Estimated Value: $424,000 - $465,000
3
Beds
1
Bath
1,654
Sq Ft
$264/Sq Ft
Est. Value
About This Home
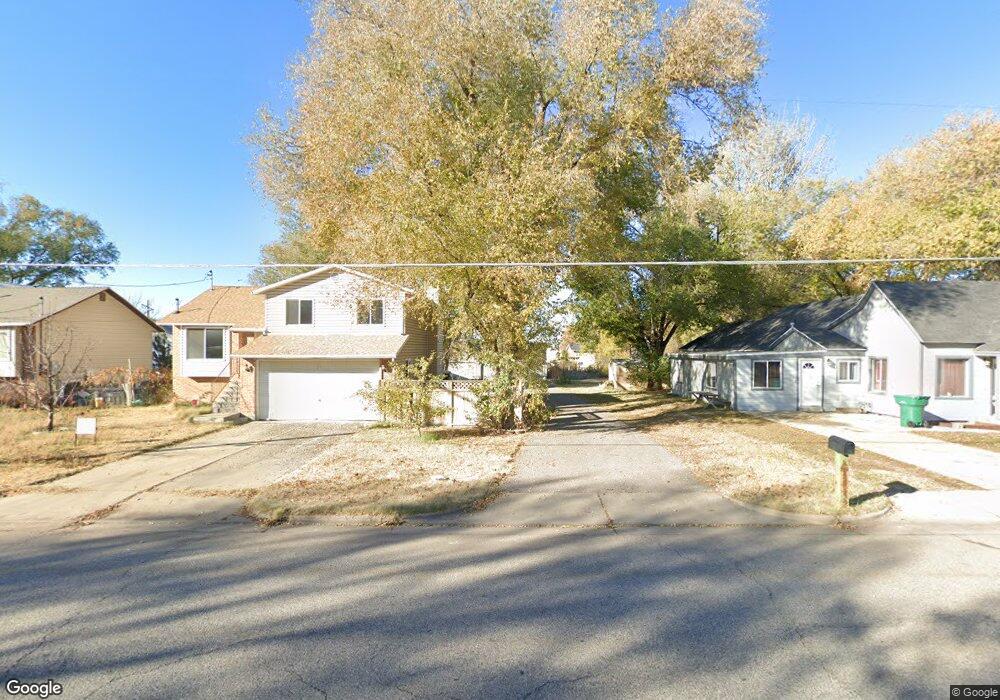
This home is located at 5767 S 2700 W, Roy, UT 84067 and is currently estimated at $437,074, approximately $264 per square foot. 5767 S 2700 W is a home located in Weber County with nearby schools including Municipal School, Roy Junior High School, and Roy High School.
Ownership History
Date
Name
Owned For
Owner Type
Purchase Details
Closed on
Dec 21, 2022
Sold by
Feasel Craig M
Bought by
Thuet Christina
Current Estimated Value
Home Financials for this Owner
Home Financials are based on the most recent Mortgage that was taken out on this home.
Original Mortgage
$320,000
Outstanding Balance
$309,728
Interest Rate
6.58%
Mortgage Type
New Conventional
Estimated Equity
$127,346
Purchase Details
Closed on
Sep 30, 2010
Sold by
Rasmussen John T
Bought by
Feasel Craig M
Home Financials for this Owner
Home Financials are based on the most recent Mortgage that was taken out on this home.
Original Mortgage
$153,500
Interest Rate
4.35%
Mortgage Type
VA
Purchase Details
Closed on
Jun 21, 2010
Sold by
Rasmussen Delbert T
Bought by
Rasmussen Delbert T and Rasmussen Ii John T
Create a Home Valuation Report for This Property
The Home Valuation Report is an in-depth analysis detailing your home's value as well as a comparison with similar homes in the area
Home Values in the Area
Average Home Value in this Area
Purchase History
| Date | Buyer | Sale Price | Title Company |
|---|---|---|---|
| Thuet Christina | -- | -- | |
| Feasel Craig M | -- | Mountain View Title Ogden | |
| Rasmussen Delbert T | -- | None Available |
Source: Public Records
Mortgage History
| Date | Status | Borrower | Loan Amount |
|---|---|---|---|
| Open | Thuet Christina | $320,000 | |
| Previous Owner | Feasel Craig M | $153,500 |
Source: Public Records
Tax History
| Year | Tax Paid | Tax Assessment Tax Assessment Total Assessment is a certain percentage of the fair market value that is determined by local assessors to be the total taxable value of land and additions on the property. | Land | Improvement |
|---|---|---|---|---|
| 2025 | $2,656 | $416,907 | $137,979 | $278,928 |
| 2024 | $2,572 | $223,297 | $75,957 | $147,340 |
| 2023 | $2,345 | $202,401 | $64,861 | $137,540 |
| 2022 | $2,293 | $259,600 | $64,220 | $195,380 |
| 2021 | $1,595 | $324,999 | $77,284 | $247,715 |
| 2020 | $1,346 | $270,000 | $77,284 | $192,716 |
| 2019 | $1,241 | $244,001 | $50,082 | $193,919 |
| 2018 | $1,099 | $215,001 | $44,874 | $170,127 |
| 2017 | $859 | $175,999 | $44,874 | $131,125 |
| 2016 | $1,546 | $92,328 | $22,888 | $69,440 |
| 2015 | $702 | $86,161 | $25,625 | $60,536 |
| 2014 | $694 | $84,665 | $19,800 | $64,865 |
Source: Public Records
Map
Nearby Homes
- 5773 S 2700 W
- 5768 S 2775 W
- 5782 S 2775 W
- 5745 S 2700 W
- 5759 S 2700 W
- 5756 S 2775 W
- 5794 S 2775 W
- 5795 S 2700 W
- 5740 S 2775 W
- 5798 S 2775 W
- 5739 S 2700 W
- 5760 S 2700 W Unit 5760
- 5730 S 2775 W
- 5804 S 2775 W
- 5727 S 2700 W
- 5777 S 2700 W
- 5756 S 2700 W Unit Duplex Apartment 575
- 5756 S 2700 W
- 5758 S 2700 W
- 5744 S 2700 W
Your Personal Tour Guide
Ask me questions while you tour the home.