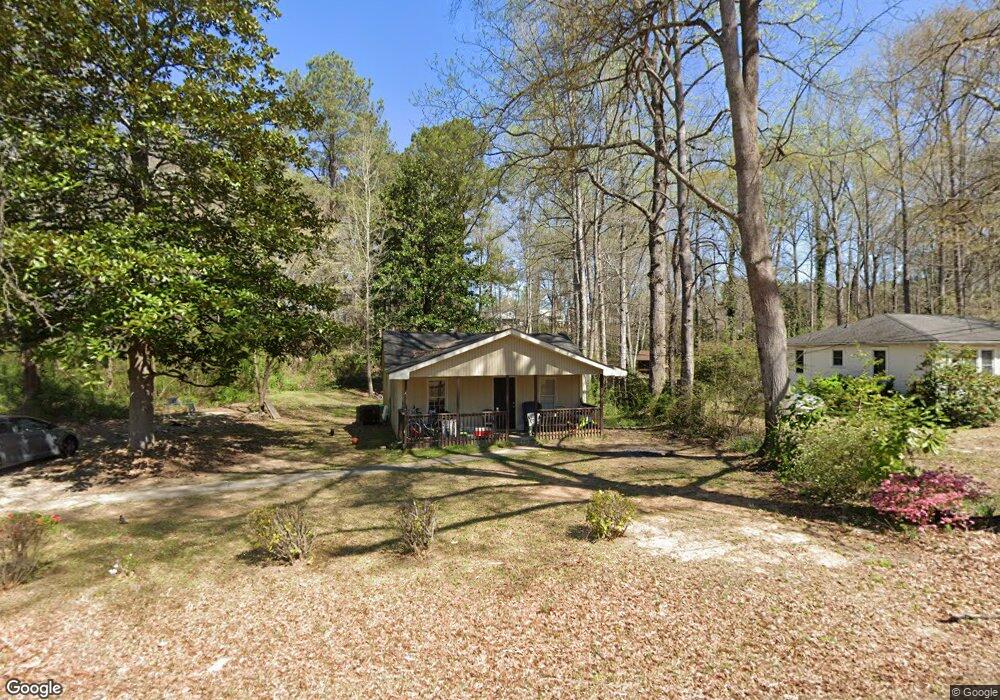
5768 Dogwood Cir Austell, GA 30168
Estimated Value: $223,000 - $275,000
3
Beds
2
Baths
1,248
Sq Ft
$198/Sq Ft
Est. Value
About This Home
This home is located at 5768 Dogwood Cir, Austell, GA 30168 and is currently estimated at $247,025, approximately $197 per square foot. 5768 Dogwood Cir is a home located in Cobb County with nearby schools including Deerwood Elementary School, Mableton Elementary School, and Garrett Middle School.
Ownership History
Date
Name
Owned For
Owner Type
Purchase Details
Closed on
Aug 8, 2018
Sold by
Rha 1 Llc
Bought by
Fyr Sfr Borrower Llc
Current Estimated Value
Purchase Details
Closed on
Oct 23, 2013
Sold by
Global Logistics Resource
Bought by
Rha 1 Llc
Purchase Details
Closed on
Jun 5, 2012
Sold by
Bank Of America Na
Bought by
Secretary Of Housing And Urban and Conn C O Michaelson
Purchase Details
Closed on
Sep 30, 2004
Sold by
Vision Of Souls Outreach Center Ch
Bought by
Hinson Linda K
Home Financials for this Owner
Home Financials are based on the most recent Mortgage that was taken out on this home.
Original Mortgage
$91,858
Interest Rate
5.73%
Mortgage Type
VA
Purchase Details
Closed on
Feb 24, 2003
Sold by
Boudwin Herbert J and Boudwin Aerrie M
Bought by
Vision For Souls Outreach Center
Create a Home Valuation Report for This Property
The Home Valuation Report is an in-depth analysis detailing your home's value as well as a comparison with similar homes in the area
Home Values in the Area
Average Home Value in this Area
Purchase History
| Date | Buyer | Sale Price | Title Company |
|---|---|---|---|
| Fyr Sfr Borrower Llc | $100,733 | -- | |
| Rha 1 Llc | $32,000 | -- | |
| Global Logistics Resource Inc | $24,701 | -- | |
| Secretary Of Housing And Urban | $87,910 | -- | |
| Bank Of America Na | $87,910 | -- | |
| Hinson Linda K | $93,300 | -- | |
| Vision For Souls Outreach Center | $60,000 | -- |
Source: Public Records
Mortgage History
| Date | Status | Borrower | Loan Amount |
|---|---|---|---|
| Previous Owner | Hinson Linda K | $91,858 |
Source: Public Records
Tax History Compared to Growth
Tax History
| Year | Tax Paid | Tax Assessment Tax Assessment Total Assessment is a certain percentage of the fair market value that is determined by local assessors to be the total taxable value of land and additions on the property. | Land | Improvement |
|---|---|---|---|---|
| 2025 | $2,630 | $87,284 | $33,060 | $54,224 |
| 2024 | $1,719 | $57,028 | $20,880 | $36,148 |
| 2023 | $1,719 | $57,028 | $20,880 | $36,148 |
| 2022 | $1,731 | $57,028 | $20,880 | $36,148 |
| 2021 | $1,497 | $49,320 | $18,096 | $31,224 |
| 2020 | $1,089 | $35,876 | $13,920 | $21,956 |
| 2019 | $1,089 | $35,876 | $13,920 | $21,956 |
| 2018 | $838 | $27,612 | $8,004 | $19,608 |
| 2017 | $573 | $19,928 | $5,220 | $14,708 |
| 2016 | $573 | $19,928 | $5,220 | $14,708 |
| 2015 | $565 | $19,168 | $3,480 | $15,688 |
| 2014 | $380 | $12,776 | $0 | $0 |
Source: Public Records
Map
Nearby Homes
- 0 Dogwood Cir Unit 7671035
- 0 Dogwood Cir Unit 10630776
- 1995 Oak Ct
- 1995 Matt Dr
- 2145 Venesa Cir
- 1984 Brenda Dr
- 5425 Davis Dr
- 1841 Mobley St
- 2070 Ravencliff Dr
- 1676 Veterans Memorial Hwy SW
- 2335 Ravencliff Dr
- 2335 Ravencliff Dr Unit 91
- 0 Harris St Unit 7661273
- 5466 Davis Dr
- 2425 Ravencliff Dr Unit 88
- 2425 Ravencliff Dr
- 5590 Lakeview Dr SW
- The Norwood II Plan at Sanders Park
- The Greenbrier II Plan at Sanders Park
- The Ellison II Plan at Sanders Park
- 5768 Dogwood Cir Unit 5768
- 5768 Dogwood Cir
- 5700 Dogwood Cir
- 5700 Dogwood Cir
- 5684 Dogwood Cir
- 5711 Dogwood Cir
- 5680 Pinecrest Rd
- 5714 Pinecrest Rd
- 1899 Veterans Memorial Hwy
- 5660 Pinecrest Rd
- 5735 Dogwood Cir
- 5734 Dogwood Cir
- 5743 Dogwood Cir
- 5701 Lisa Ln
- 1885 Veterans Memorial Hwy SW
- 1885 Veterans Memorial Hwy SW
- 1889 Veterans Memorial Hwy SW
- 1889 Veterans Memorial Hwy SW
- 5711 Lisa Ln
- 5754 Pinecrest Rd