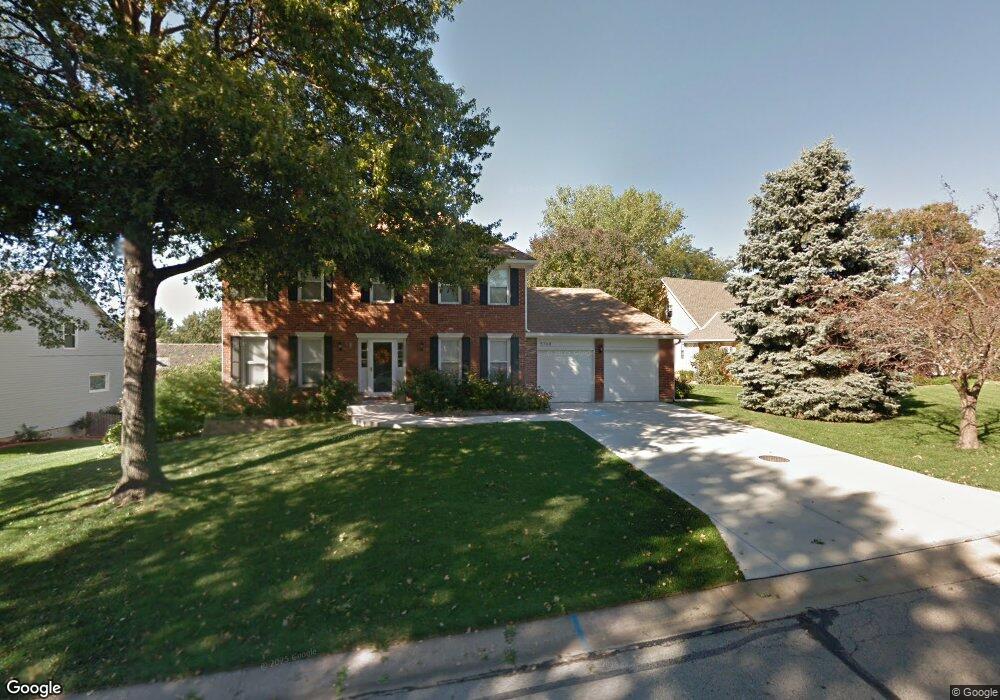
5768 Richards Cir Shawnee, KS 66216
Estimated Value: $426,000 - $470,000
4
Beds
4
Baths
2,223
Sq Ft
$200/Sq Ft
Est. Value
About This Home
This home is located at 5768 Richards Cir, Shawnee, KS 66216 and is currently estimated at $444,731, approximately $200 per square foot. 5768 Richards Cir is a home located in Johnson County with nearby schools including Ray Marsh Elementary School, Trailridge Middle School, and Shawnee Mission Northwest High School.
Ownership History
Date
Name
Owned For
Owner Type
Purchase Details
Closed on
Dec 13, 2012
Sold by
Ray Patrick A and Ray Julie A
Bought by
Ray Patrick A and Ray Julie G
Current Estimated Value
Home Financials for this Owner
Home Financials are based on the most recent Mortgage that was taken out on this home.
Original Mortgage
$148,359
Outstanding Balance
$22,477
Interest Rate
2.71%
Mortgage Type
New Conventional
Estimated Equity
$422,254
Purchase Details
Closed on
Jul 13, 2005
Sold by
Eberhart Paul B and Eberhart Laura L
Bought by
Ra Patrick A and Gervasini Julie
Home Financials for this Owner
Home Financials are based on the most recent Mortgage that was taken out on this home.
Original Mortgage
$195,000
Interest Rate
5.58%
Mortgage Type
New Conventional
Purchase Details
Closed on
May 27, 2003
Sold by
Damato Stephen D and Damato Marianne K
Bought by
Eberhart Paul B and Eberhart Laura L
Home Financials for this Owner
Home Financials are based on the most recent Mortgage that was taken out on this home.
Original Mortgage
$202,900
Interest Rate
5.74%
Mortgage Type
VA
Create a Home Valuation Report for This Property
The Home Valuation Report is an in-depth analysis detailing your home's value as well as a comparison with similar homes in the area
Home Values in the Area
Average Home Value in this Area
Purchase History
| Date | Buyer | Sale Price | Title Company |
|---|---|---|---|
| Ray Patrick A | -- | None Available | |
| Ra Patrick A | -- | Chicago Title Ins Co | |
| Eberhart Paul B | -- | Chicago Title Insurance Co |
Source: Public Records
Mortgage History
| Date | Status | Borrower | Loan Amount |
|---|---|---|---|
| Open | Ray Patrick A | $148,359 | |
| Previous Owner | Ra Patrick A | $195,000 | |
| Previous Owner | Eberhart Paul B | $202,900 |
Source: Public Records
Tax History
| Year | Tax Paid | Tax Assessment Tax Assessment Total Assessment is a certain percentage of the fair market value that is determined by local assessors to be the total taxable value of land and additions on the property. | Land | Improvement |
|---|---|---|---|---|
| 2025 | $5,025 | $49,704 | $9,120 | $40,584 |
| 2024 | $5,025 | $47,311 | $7,536 | $39,775 |
| 2023 | $4,478 | $41,745 | $7,536 | $34,209 |
| 2022 | $4,154 | $38,594 | $7,536 | $31,058 |
| 2021 | $3,812 | $33,258 | $6,848 | $26,410 |
| 2020 | $3,930 | $33,844 | $6,227 | $27,617 |
| 2019 | $3,698 | $31,820 | $5,697 | $26,123 |
| 2018 | $3,502 | $30,015 | $5,697 | $24,318 |
| 2017 | $3,289 | $27,738 | $5,178 | $22,560 |
| 2016 | $3,278 | $27,301 | $5,178 | $22,123 |
| 2015 | $2,993 | $25,852 | $5,178 | $20,674 |
| 2013 | -- | $24,621 | $5,178 | $19,443 |
Source: Public Records
Map
Nearby Homes
- 5751 Richards Cir
- 5711 Westgate St
- 13216 W 55th Terrace
- 5627 Long Ave
- 5828 Park Cir
- 5860 Park St Unit 7
- 13721 W 58th Terrace Unit 1
- 5860 Park Unit #12 St
- 5703 Cottonwood St
- 13821 W 58th Terrace Unit 1
- 13825 W 58th Terrace Unit 6
- 5702 Halsey St
- 5519 Monrovia St
- 6145 Park St
- 11903 W 58th Terrace Unit H
- 12000 W 60th Place
- 13505 W 53rd Terrace
- 14116 W 56th Ct
- 5916 Albervan St
- 13130 W 52nd Terrace
- 5762 Richards Cir
- 5774 Richards Cir
- 13019 W 57th Terrace
- 5754 Richards Cir
- 13023 W 57th Terrace
- 5775 Richards Cir
- 5780 Richards Cir
- 13015 W 57th Terrace
- 5767 Richards Cir
- 5771 Richards Cir
- 5779 Richards Cir
- 5748 Richards Cir
- 13027 W 57th Terrace
- 13014 W 57th Terrace
- 5742 Richards Cir
- 5811 Noland Rd
- 5763 Richards Cir
- 13018 W 57th Terrace
- 13022 W 57th Terrace
- 5736 Richards Cir
Your Personal Tour Guide
Ask me questions while you tour the home.