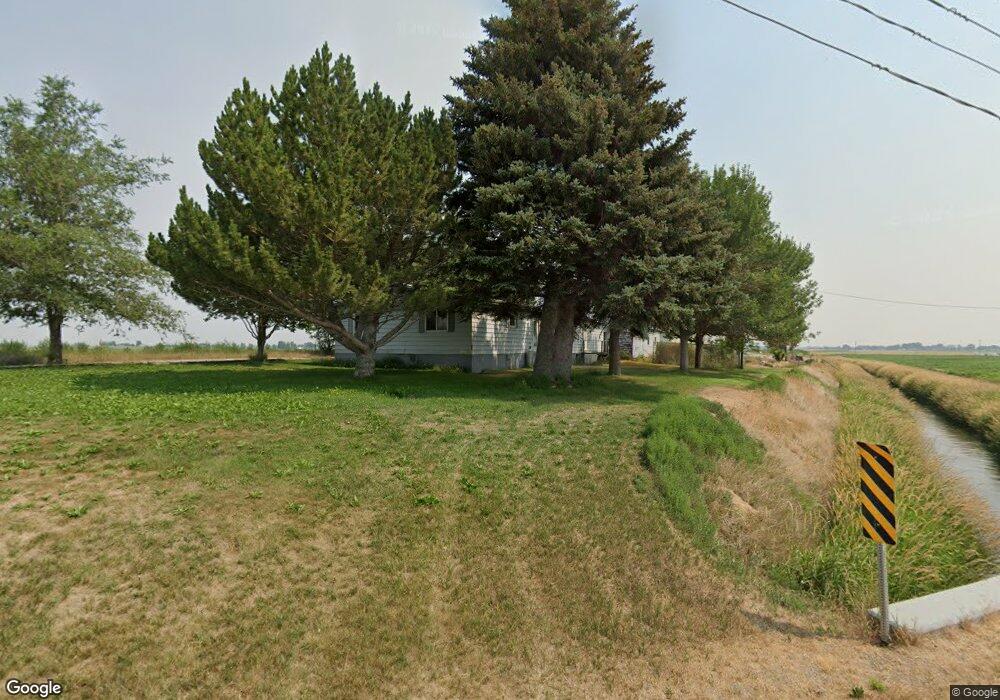
5768 W 65th S Idaho Falls, ID 83402
Estimated Value: $573,000 - $711,055
3
Beds
1
Bath
2,222
Sq Ft
$286/Sq Ft
Est. Value
About This Home
This home is located at 5768 W 65th S, Idaho Falls, ID 83402 and is currently estimated at $634,514, approximately $285 per square foot. 5768 W 65th S is a home located in Bonneville County with nearby schools including Riverview Elementary School, Sunrise Elementary School, and Donald J. Hobbs Middle School.
Ownership History
Date
Name
Owned For
Owner Type
Purchase Details
Closed on
May 27, 2021
Sold by
Thompson Mark H and Thompson Rhonda
Bought by
Thompson Rhonda and Thompson Mark H
Current Estimated Value
Home Financials for this Owner
Home Financials are based on the most recent Mortgage that was taken out on this home.
Original Mortgage
$346,700
Outstanding Balance
$313,209
Interest Rate
2.9%
Mortgage Type
New Conventional
Estimated Equity
$321,305
Purchase Details
Closed on
Nov 15, 2017
Sold by
Thompson Mark H
Bought by
Thompson Mark H and Thompson Rhonda
Purchase Details
Closed on
Mar 6, 2014
Sold by
Tueller Michelle
Bought by
Thompson Mark H
Purchase Details
Closed on
Jun 1, 2012
Sold by
Thompson Roland John
Bought by
Thompson Mark H
Create a Home Valuation Report for This Property
The Home Valuation Report is an in-depth analysis detailing your home's value as well as a comparison with similar homes in the area
Home Values in the Area
Average Home Value in this Area
Purchase History
| Date | Buyer | Sale Price | Title Company |
|---|---|---|---|
| Thompson Rhonda | -- | Titleone Twin Falls | |
| Thompson Mark H | -- | Amerititle | |
| Thompson Mark H | -- | None Available | |
| Thompson Mark H | -- | None Available |
Source: Public Records
Mortgage History
| Date | Status | Borrower | Loan Amount |
|---|---|---|---|
| Open | Thompson Rhonda | $346,700 |
Source: Public Records
Tax History Compared to Growth
Tax History
| Year | Tax Paid | Tax Assessment Tax Assessment Total Assessment is a certain percentage of the fair market value that is determined by local assessors to be the total taxable value of land and additions on the property. | Land | Improvement |
|---|---|---|---|---|
| 2025 | $1,590 | $628,210 | $32,000 | $596,210 |
| 2024 | $1,590 | $565,110 | $7,500 | $557,610 |
| 2023 | $1,613 | $539,610 | $81,900 | $457,710 |
| 2022 | $2,220 | $471,330 | $76,900 | $394,430 |
| 2021 | $367 | $87,120 | $76,900 | $10,220 |
| 2019 | $424 | $75,120 | $64,900 | $10,220 |
| 2018 | $434 | $74,120 | $63,900 | $10,220 |
| 2017 | $425 | $69,120 | $58,900 | $10,220 |
| 2016 | $428 | $66,120 | $55,900 | $10,220 |
| 2015 | $205 | $59,560 | $55,900 | $3,660 |
| 2014 | $9,106 | $59,560 | $48,900 | $10,660 |
| 2013 | $416 | $59,560 | $48,900 | $10,660 |
Source: Public Records
Map
Nearby Homes