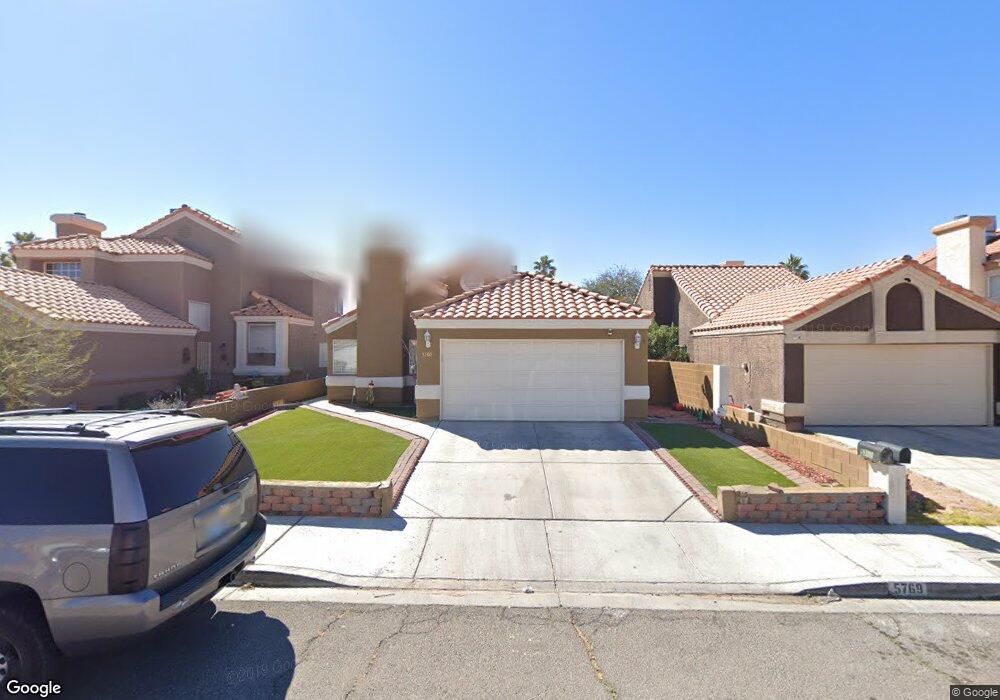
5769 Yerington Ave Las Vegas, NV 89110
Estimated Value: $394,000 - $398,073
3
Beds
3
Baths
1,334
Sq Ft
$296/Sq Ft
Est. Value
About This Home
This home is located at 5769 Yerington Ave, Las Vegas, NV 89110 and is currently estimated at $395,268, approximately $296 per square foot. 5769 Yerington Ave is a home located in Clark County with nearby schools including Richard J. Rundle Elementary School, Charlotte & Jerry Keller Elementary School, and Duane D. Keller Middle School.
Ownership History
Date
Name
Owned For
Owner Type
Purchase Details
Closed on
Aug 5, 2021
Sold by
Samaniego Beatriz
Bought by
Juarez Erendira
Current Estimated Value
Home Financials for this Owner
Home Financials are based on the most recent Mortgage that was taken out on this home.
Original Mortgage
$305,550
Outstanding Balance
$277,840
Interest Rate
2.9%
Mortgage Type
New Conventional
Estimated Equity
$117,428
Purchase Details
Closed on
Sep 28, 2011
Sold by
Moore Mark C
Bought by
Samaniego Beatriz
Home Financials for this Owner
Home Financials are based on the most recent Mortgage that was taken out on this home.
Original Mortgage
$70,400
Interest Rate
4.09%
Mortgage Type
New Conventional
Purchase Details
Closed on
Apr 10, 2007
Sold by
Moore Harold D
Bought by
Moore Harold D and The Moore Family Trust
Create a Home Valuation Report for This Property
The Home Valuation Report is an in-depth analysis detailing your home's value as well as a comparison with similar homes in the area
Home Values in the Area
Average Home Value in this Area
Purchase History
| Date | Buyer | Sale Price | Title Company |
|---|---|---|---|
| Juarez Erendira | $316,000 | Wfg National Title Compan | |
| Samaniego Beatriz | $88,000 | Ticor Title Las Vegas | |
| Moore Harold D | -- | None Available |
Source: Public Records
Mortgage History
| Date | Status | Borrower | Loan Amount |
|---|---|---|---|
| Open | Juarez Erendira | $305,550 | |
| Previous Owner | Samaniego Beatriz | $70,400 |
Source: Public Records
Tax History Compared to Growth
Tax History
| Year | Tax Paid | Tax Assessment Tax Assessment Total Assessment is a certain percentage of the fair market value that is determined by local assessors to be the total taxable value of land and additions on the property. | Land | Improvement |
|---|---|---|---|---|
| 2025 | $1,238 | $74,517 | $26,950 | $47,567 |
| 2024 | $1,202 | $74,517 | $26,950 | $47,567 |
| 2023 | $880 | $71,999 | $26,600 | $45,399 |
| 2022 | $1,224 | $63,380 | $21,350 | $42,030 |
| 2021 | $1,133 | $59,758 | $19,600 | $40,158 |
| 2020 | $1,049 | $59,403 | $19,250 | $40,153 |
| 2019 | $983 | $57,409 | $17,500 | $39,909 |
| 2018 | $938 | $51,953 | $13,300 | $38,653 |
| 2017 | $1,453 | $49,559 | $10,150 | $39,409 |
| 2016 | $880 | $44,400 | $8,400 | $36,000 |
| 2015 | $877 | $40,922 | $5,950 | $34,972 |
| 2014 | $850 | $28,989 | $4,550 | $24,439 |
Source: Public Records
Map
Nearby Homes
- 5854 Heather Marie Dr
- 741 Round Table Dr
- 522 Wheaties Way
- 316 Linn Ln
- 5529 Cedar Ave
- 5907 Zawawi Ct
- 262 Solicito St
- 266 Lyra Ln
- 656 N Christy Ln
- 730 N Christy Ln
- 563 Moon Chase St
- 740 Santree Cir
- 0 Madge Ln
- 360 Sir Richard Dr E
- 0 Washington Unit 2360795
- 332 Sir Jeffery Cir
- 910 N Sloan Ln Unit 201
- 6209 Exquisite Ave
- 5364 Awbury Ave
- 280 Sir Phillip St
- 5763 Yerington Ave
- 5775 Yerington Ave
- 5757 Yerington Ave
- 5781 Yerington Ave
- 5781 Yerington Ave
- 5781 Yerington Ave
- 5792 Goodsprings Ct
- 5796 Goodsprings Ct
- 5787 Yerington Ave
- 512 Battle Mountain Dr
- 518 Battle Mountain Dr
- 524 Battle Mountain Dr
- 5770 Yerington Ave
- 5766 Yerington Ave
- 530 Battle Mountain Dr
- 508 Battle Mountain Dr
- 5776 Yerington Ave
- 5797 Yerington Ave
- 5802 Goodsprings Ct
- 5782 Yerington Ave