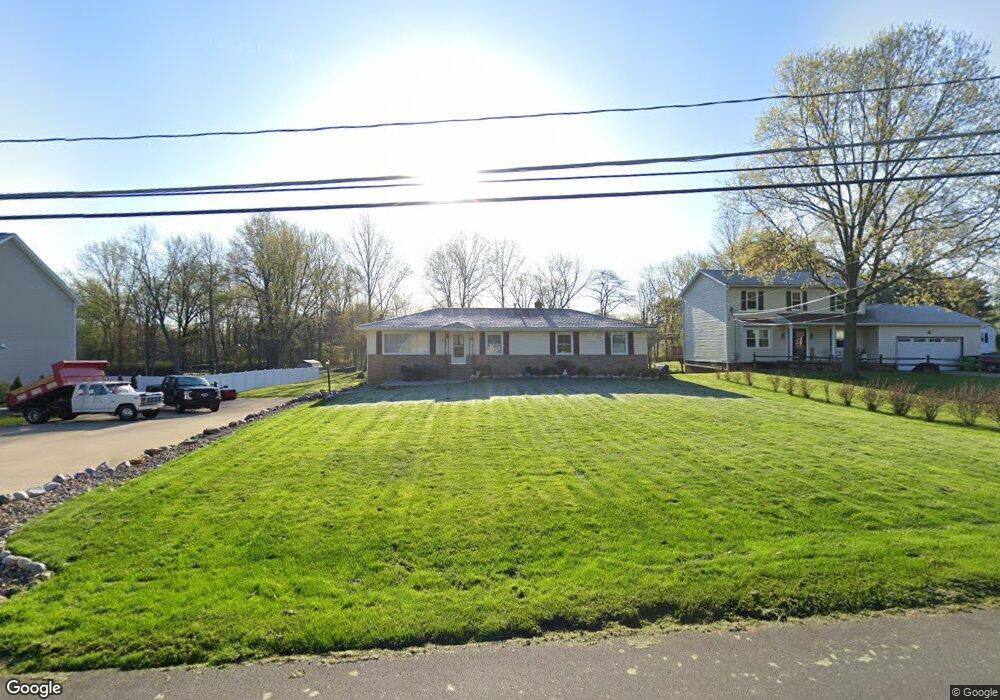
577 Dunbar Rd Tallmadge, OH 44278
Estimated Value: $259,760 - $319,000
3
Beds
2
Baths
1,680
Sq Ft
$177/Sq Ft
Est. Value
About This Home
This home is located at 577 Dunbar Rd, Tallmadge, OH 44278 and is currently estimated at $297,440, approximately $177 per square foot. 577 Dunbar Rd is a home located in Summit County with nearby schools including Tallmadge Middle School, Tallmadge High School, and Cornerstone Community School.
Ownership History
Date
Name
Owned For
Owner Type
Purchase Details
Closed on
Jun 23, 2021
Sold by
Tricaso Mary E
Bought by
Tricaso Mary E and Wright Richard W
Current Estimated Value
Home Financials for this Owner
Home Financials are based on the most recent Mortgage that was taken out on this home.
Original Mortgage
$132,800
Outstanding Balance
$120,234
Interest Rate
2.9%
Mortgage Type
New Conventional
Estimated Equity
$177,206
Purchase Details
Closed on
May 13, 2015
Sold by
Tricaso Joseph A and Tricaso Doris E
Bought by
Tricaso Mary E
Home Financials for this Owner
Home Financials are based on the most recent Mortgage that was taken out on this home.
Original Mortgage
$152,000
Interest Rate
3.64%
Mortgage Type
New Conventional
Purchase Details
Closed on
Aug 1, 2014
Sold by
Tricaso Joseph A and Tricaso Doris E
Bought by
Tricaso Joseph A and Tricaso Doris E
Create a Home Valuation Report for This Property
The Home Valuation Report is an in-depth analysis detailing your home's value as well as a comparison with similar homes in the area
Home Values in the Area
Average Home Value in this Area
Purchase History
| Date | Buyer | Sale Price | Title Company |
|---|---|---|---|
| Tricaso Mary E | -- | First American Title | |
| Tricaso Mary E | $160,000 | Beacon Title Agency Inc | |
| Tricaso Joseph A | -- | Diamond Title Co |
Source: Public Records
Mortgage History
| Date | Status | Borrower | Loan Amount |
|---|---|---|---|
| Open | Tricaso Mary E | $132,800 | |
| Previous Owner | Tricaso Mary E | $152,000 |
Source: Public Records
Tax History Compared to Growth
Tax History
| Year | Tax Paid | Tax Assessment Tax Assessment Total Assessment is a certain percentage of the fair market value that is determined by local assessors to be the total taxable value of land and additions on the property. | Land | Improvement |
|---|---|---|---|---|
| 2025 | $3,439 | $67,544 | $14,053 | $53,491 |
| 2024 | $3,439 | $67,544 | $14,053 | $53,491 |
| 2023 | $3,439 | $67,544 | $14,053 | $53,491 |
| 2022 | $3,508 | $56,347 | $11,711 | $44,636 |
| 2021 | $3,524 | $56,347 | $11,711 | $44,636 |
| 2020 | $3,496 | $56,350 | $11,710 | $44,640 |
| 2019 | $3,407 | $49,070 | $16,950 | $32,120 |
| 2018 | $3,010 | $49,070 | $16,950 | $32,120 |
| 2017 | $2,507 | $49,070 | $16,950 | $32,120 |
| 2016 | $3,269 | $49,070 | $16,950 | $32,120 |
| 2015 | $2,507 | $49,070 | $16,950 | $32,120 |
| 2014 | $2,491 | $49,070 | $16,950 | $32,120 |
Source: Public Records
Map
Nearby Homes
- 915 Treat Blvd
- 1075 Amy Trail
- 187 Oakview Cir
- 280 Woodside Ln
- 1034 Southeast Ave
- 330 Hanna Dr
- 549 S Munroe Rd
- 523 S Munroe Rd
- 810 Norton Dr
- 490 Vandalia Dr
- 750 Danner Rd
- 315 Fawnwood Dr
- 228 Dunbar Rd
- 1239 Glenoak Dr
- 206 Fawnwood Dr
- 988 Beechwood Dr
- 288 S Munroe Rd
- 243 S Munroe Rd
- 3167 Mogadore Rd
- 758 Humble Rd