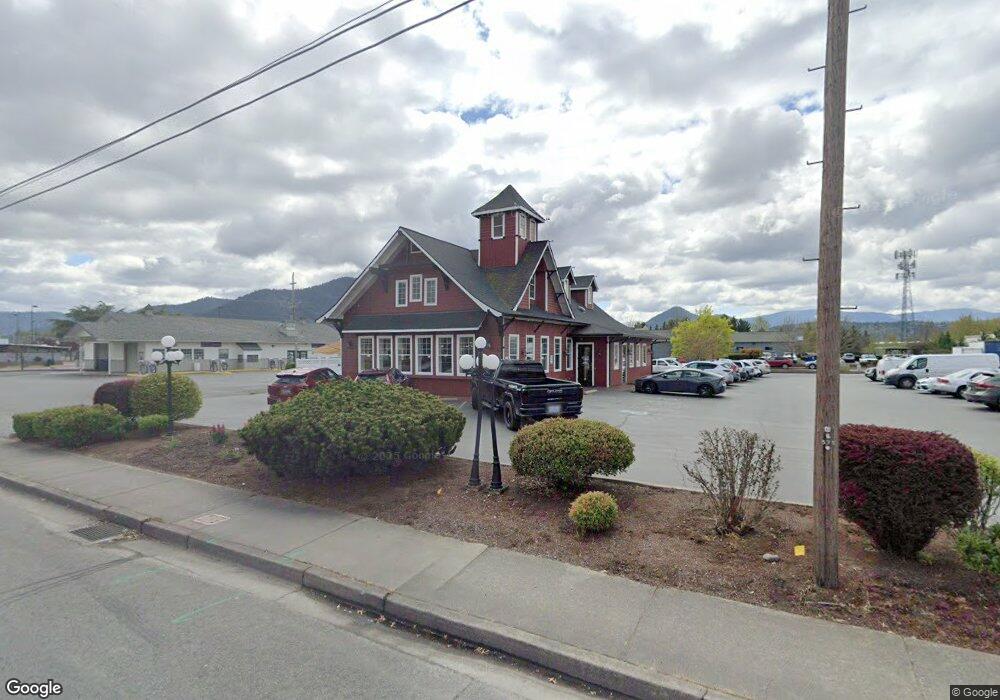
577 NE F St Grants Pass, OR 97526
Estimated Value: $677,006
--
Bed
2
Baths
2,578
Sq Ft
$263/Sq Ft
Est. Value
About This Home
This home is located at 577 NE F St, Grants Pass, OR 97526 and is currently estimated at $677,006, approximately $262 per square foot. 577 NE F St is a home located in Josephine County with nearby schools including Riverside Elementary School, North Middle School, and Grants Pass High School.
Ownership History
Date
Name
Owned For
Owner Type
Purchase Details
Closed on
Aug 4, 2006
Sold by
Carnes Darla
Bought by
Bob Dar Llc
Current Estimated Value
Purchase Details
Closed on
Jan 27, 2006
Sold by
Lawyers Exchange Carnes Llc
Bought by
Carnes Darla
Purchase Details
Closed on
Aug 3, 2005
Sold by
Anderson Steven M and Anderson Stephanie A
Bought by
Lawyers Exchange Carnes Llc
Home Financials for this Owner
Home Financials are based on the most recent Mortgage that was taken out on this home.
Original Mortgage
$117,778
Interest Rate
5.46%
Mortgage Type
Seller Take Back
Create a Home Valuation Report for This Property
The Home Valuation Report is an in-depth analysis detailing your home's value as well as a comparison with similar homes in the area
Home Values in the Area
Average Home Value in this Area
Purchase History
| Date | Buyer | Sale Price | Title Company |
|---|---|---|---|
| Bob Dar Llc | -- | None Available | |
| Carnes Darla | -- | None Available | |
| Lawyers Exchange Carnes Llc | $442,778 | Ticor Title |
Source: Public Records
Mortgage History
| Date | Status | Borrower | Loan Amount |
|---|---|---|---|
| Previous Owner | Lawyers Exchange Carnes Llc | $117,778 |
Source: Public Records
Tax History Compared to Growth
Tax History
| Year | Tax Paid | Tax Assessment Tax Assessment Total Assessment is a certain percentage of the fair market value that is determined by local assessors to be the total taxable value of land and additions on the property. | Land | Improvement |
|---|---|---|---|---|
| 2025 | $8,767 | $675,100 | -- | -- |
| 2024 | $8,767 | $655,440 | -- | -- |
| 2023 | $8,209 | $636,350 | $412,510 | $223,840 |
| 2022 | $8,350 | $621,840 | -- | -- |
| 2021 | $7,742 | $603,730 | $0 | $0 |
| 2020 | $7,626 | $591,610 | $0 | $0 |
| 2019 | $7,465 | $574,380 | $0 | $0 |
| 2018 | $7,596 | $557,660 | $0 | $0 |
| 2017 | $7,539 | $541,420 | $0 | $0 |
| 2016 | $6,423 | $525,660 | $0 | $0 |
| 2015 | $6,399 | $525,660 | $0 | $0 |
| 2014 | $6,339 | $515,830 | $0 | $0 |
Source: Public Records
Map
Nearby Homes
- 811 NE Clyde Place
- 811 NE Clyde Place Unit 116 C
- 715 NE A St
- 702 NE A St
- 415 SE J St
- 425 NE Silverwood Place
- 409 SE J St
- 419 NE Silverwood Place
- 431 NE Silverwood Place
- 418 NE 11th St
- 710 SE 12th St
- 711 SE Riverside Ave
- 702 SE 9th St
- 861 SE M St
- 737 SE M St
- 728 NW 6th St
- 1405 NE Laura Ct
- 139 SW I St
- 619 SE M St
- 807 NW 5th St