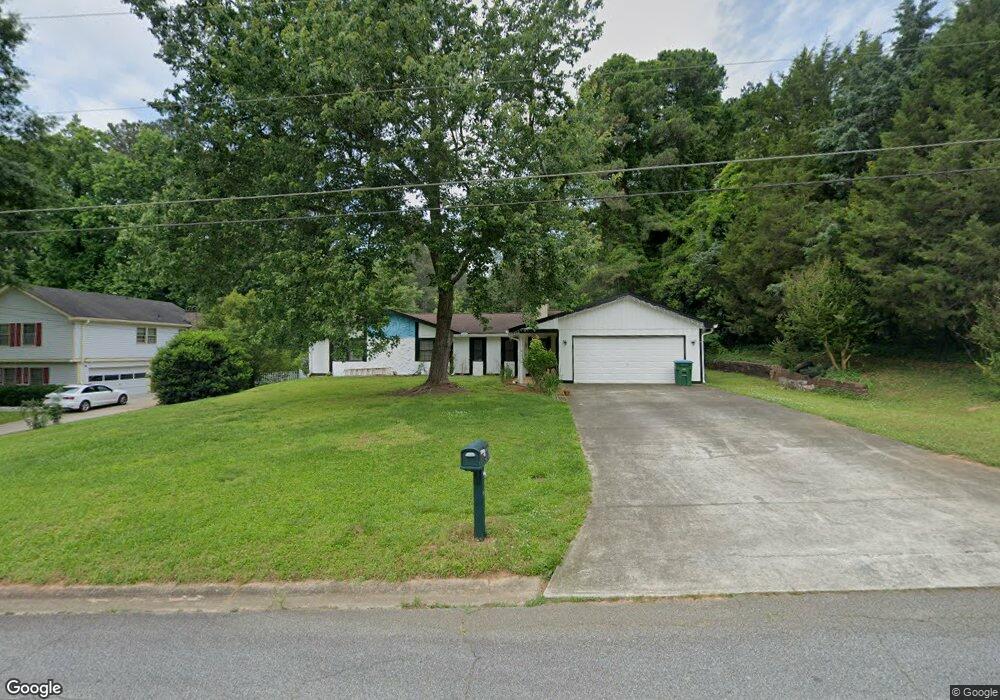
577 Planters Row SW Unit 6 Lilburn, GA 30047
Estimated Value: $334,000 - $361,000
3
Beds
2
Baths
1,444
Sq Ft
$240/Sq Ft
Est. Value
About This Home
This home is located at 577 Planters Row SW Unit 6, Lilburn, GA 30047 and is currently estimated at $347,172, approximately $240 per square foot. 577 Planters Row SW Unit 6 is a home located in Gwinnett County with nearby schools including Camp Creek Elementary School, Trickum Middle School, and Parkview High School.
Ownership History
Date
Name
Owned For
Owner Type
Purchase Details
Closed on
Dec 3, 2019
Sold by
Lung Len
Bought by
Lung Len and Hla Shwe
Current Estimated Value
Home Financials for this Owner
Home Financials are based on the most recent Mortgage that was taken out on this home.
Original Mortgage
$196,377
Outstanding Balance
$172,387
Interest Rate
3.6%
Mortgage Type
FHA
Estimated Equity
$174,785
Purchase Details
Closed on
May 25, 2012
Sold by
Lee Brenda F
Bought by
Mapchan Til
Home Financials for this Owner
Home Financials are based on the most recent Mortgage that was taken out on this home.
Original Mortgage
$107,211
Interest Rate
3.87%
Mortgage Type
FHA
Purchase Details
Closed on
Oct 20, 1999
Sold by
Noe Jr Theodore William
Bought by
Lee Brenda F
Home Financials for this Owner
Home Financials are based on the most recent Mortgage that was taken out on this home.
Original Mortgage
$105,000
Interest Rate
7.91%
Mortgage Type
New Conventional
Purchase Details
Closed on
May 28, 1999
Sold by
Kidder-Noe Carola B
Bought by
Noe Theodore W
Purchase Details
Closed on
Apr 3, 1995
Sold by
Huffman Frank Rita D
Bought by
Noe Theodore W Carole
Create a Home Valuation Report for This Property
The Home Valuation Report is an in-depth analysis detailing your home's value as well as a comparison with similar homes in the area
Home Values in the Area
Average Home Value in this Area
Purchase History
| Date | Buyer | Sale Price | Title Company |
|---|---|---|---|
| Lung Len | -- | -- | |
| Lung Len | $200,000 | -- | |
| Mapchan Til | $110,000 | -- | |
| Lee Brenda F | $136,000 | -- | |
| Noe Theodore W | -- | -- | |
| Noe Theodore W Carole | $94,900 | -- |
Source: Public Records
Mortgage History
| Date | Status | Borrower | Loan Amount |
|---|---|---|---|
| Open | Lung Len | $196,377 | |
| Closed | Lung Len | $196,377 | |
| Previous Owner | Mapchan Til | $107,211 | |
| Previous Owner | Lee Brenda F | $105,000 | |
| Closed | Noe Theodore W Carole | $0 |
Source: Public Records
Tax History Compared to Growth
Tax History
| Year | Tax Paid | Tax Assessment Tax Assessment Total Assessment is a certain percentage of the fair market value that is determined by local assessors to be the total taxable value of land and additions on the property. | Land | Improvement |
|---|---|---|---|---|
| 2025 | $3,693 | $120,640 | $22,200 | $98,440 |
| 2024 | $3,842 | $122,240 | $22,200 | $100,040 |
| 2023 | $3,842 | $119,600 | $26,000 | $93,600 |
| 2022 | $3,419 | $103,920 | $26,000 | $77,920 |
| 2021 | $2,868 | $75,880 | $16,800 | $59,080 |
| 2020 | $2,884 | $75,880 | $16,800 | $59,080 |
| 2019 | $2,326 | $72,920 | $16,800 | $56,120 |
| 2018 | $1,993 | $57,720 | $12,800 | $44,920 |
| 2016 | $1,930 | $53,760 | $12,800 | $40,960 |
| 2015 | $1,938 | $53,560 | $11,200 | $42,360 |
| 2014 | -- | $53,560 | $11,200 | $42,360 |
Source: Public Records
Map
Nearby Homes
- 4567 Town Crier Rd SW
- 4704 Arrowhead Trail SW
- 4582 Warrior Trail SW
- 4814 Delgado Dr SW
- 562 Gregg Dr SW
- 4872 Arrowhead Trail West SW Unit 1
- 4702 Sequoia Dr SW
- 4406 Hale Dr SW
- 551 Killian Hill Rd SW
- 4367 Cedar Wood Dr SW
- 311 Arbor Point Ct SW
- 5000 Bainbridge Ct SW
- 383 Ben Ave SW
- 676 Killian Hill Rd SW
- 4307 Cedar Wood Dr SW
- 4358 Louis Rd SW
- 577 Planters Row SW
- 0 Planters Roe Unit 6
- 567 Planters Row SW
- 587 Planters Row SW
- 582 Emily Dr SW
- 572 Emily Dr SW
- 592 Emily Dr SW Unit 2
- 572 Planters Row SW Unit 2
- 582 Planters Row SW
- 557 Planters Row SW Unit 2
- 562 Planters Row SW
- 562 Emily Dr SW
- 552 Planters Row SW
- 547 Planters Row SW
- 552 Emily Dr SW Unit 552
- 552 Emily Dr SW
- 607 Planters Row SW Unit 2
- 571 Village Green Ct SW
- 4639 Silversmith Cove SW
- 581 Village Green Ct SW