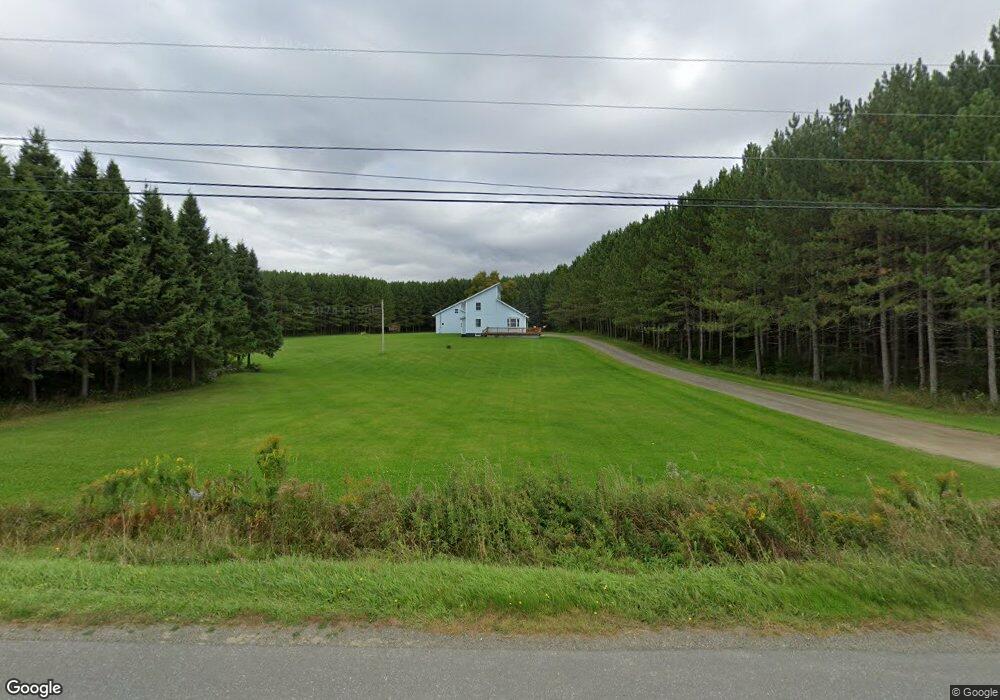
577 Pulcifur Rd Mapleton, ME 04757
Estimated Value: $215,000 - $289,000
3
Beds
2
Baths
1,353
Sq Ft
$187/Sq Ft
Est. Value
About This Home
This home is located at 577 Pulcifur Rd, Mapleton, ME 04757 and is currently estimated at $253,382, approximately $187 per square foot. 577 Pulcifur Rd is a home located in Aroostook County with nearby schools including Presque Isle Middle School and Presque Isle High School.
Ownership History
Date
Name
Owned For
Owner Type
Purchase Details
Closed on
Jan 16, 2020
Sold by
Dean Whitney
Bought by
Dean Whitney and Dean Amos
Current Estimated Value
Home Financials for this Owner
Home Financials are based on the most recent Mortgage that was taken out on this home.
Original Mortgage
$153,000
Outstanding Balance
$135,519
Interest Rate
3.73%
Mortgage Type
Stand Alone Refi Refinance Of Original Loan
Estimated Equity
$117,863
Purchase Details
Closed on
Nov 30, 2018
Sold by
Tenney Christopher R and Tenney Lynne M
Bought by
Dean Whitney
Home Financials for this Owner
Home Financials are based on the most recent Mortgage that was taken out on this home.
Original Mortgage
$152,000
Interest Rate
4.8%
Mortgage Type
New Conventional
Purchase Details
Closed on
Nov 5, 2010
Sold by
Maxcy Stuart H and Maxcy Malia K
Bought by
Tenney Christopher and Tenney Lynn
Create a Home Valuation Report for This Property
The Home Valuation Report is an in-depth analysis detailing your home's value as well as a comparison with similar homes in the area
Purchase History
| Date | Buyer | Sale Price | Title Company |
|---|---|---|---|
| Dean Whitney | -- | None Available | |
| Dean Whitney | -- | None Available | |
| Dean Whitney | -- | -- | |
| Dean Whitney | -- | -- | |
| Tenney Christopher | -- | -- | |
| Tenney Christopher | -- | -- |
Source: Public Records
Mortgage History
| Date | Status | Borrower | Loan Amount |
|---|---|---|---|
| Open | Dean Whitney | $153,000 | |
| Closed | Dean Whitney | $153,000 | |
| Previous Owner | Dean Whitney | $152,000 | |
| Previous Owner | Tenney Christopher | $25,000 |
Source: Public Records
Tax History
| Year | Tax Paid | Tax Assessment Tax Assessment Total Assessment is a certain percentage of the fair market value that is determined by local assessors to be the total taxable value of land and additions on the property. | Land | Improvement |
|---|---|---|---|---|
| 2024 | $2,605 | $207,600 | $39,100 | $168,500 |
| 2023 | $2,347 | $164,700 | $33,100 | $131,600 |
| 2022 | $2,272 | $140,700 | $24,100 | $116,600 |
| 2021 | $2,272 | $140,700 | $24,100 | $116,600 |
| 2020 | $2,322 | $140,700 | $24,100 | $116,600 |
| 2019 | $2,274 | $142,100 | $24,100 | $118,000 |
| 2018 | $2,248 | $142,300 | $24,100 | $118,200 |
| 2017 | $2,219 | $143,600 | $24,100 | $119,500 |
| 2016 | $2,258 | $143,800 | $24,100 | $119,700 |
| 2015 | $2,146 | $145,000 | $24,100 | $120,900 |
| 2014 | $2,163 | $145,200 | $24,100 | $121,100 |
| 2013 | $2,123 | $146,400 | $24,100 | $122,300 |
Source: Public Records
Map
Nearby Homes
- Lot 7 Off Pulcifer Rd
- 459 Griffin Ridge Rd
- M2 L39-1 Pease Rd
- 183 Pulcifur Rd
- 1421 State Rd
- 40 Fords Ln
- 1616 Main St
- 707 Hughes Rd
- 1776 Main St
- 228 Waddell Rd
- 3091 W Chapman Rd
- 673 Mapleton Rd
- 339 Parsons Rd
- 281 Cross Rd
- 1053 Washburn Rd
- 0 Carvell Rd
- 38 Elizabeth St
- 33 Elizabeth St
- 8 Lincoln St
- 25 Turner St
- 593 Pulcifur Rd
- 605 Pulcifur Rd
- 609 Pulcifur Rd
- 567 Pulcifur Rd
- 555 Pulcifur Rd
- 549 Pulcifur Rd
- 549 Pulcifur Rd
- 637 Pulcifur Rd
- 693 Pulcifur Rd
- 543 Pulcifur Rd
- 643 Pulcifur Rd
- 667 Pulcifur Rd
- 646 Pulcifur Rd
- 679 Pulcifur Rd
- 529 Pulcifur Rd
- 701 Pulcifur Rd
- 523 Pulcifur Rd
- 713 Pulcifur Rd
- 723 Pulcifur Rd
- 515 Pulcifur Rd
Your Personal Tour Guide
Ask me questions while you tour the home.