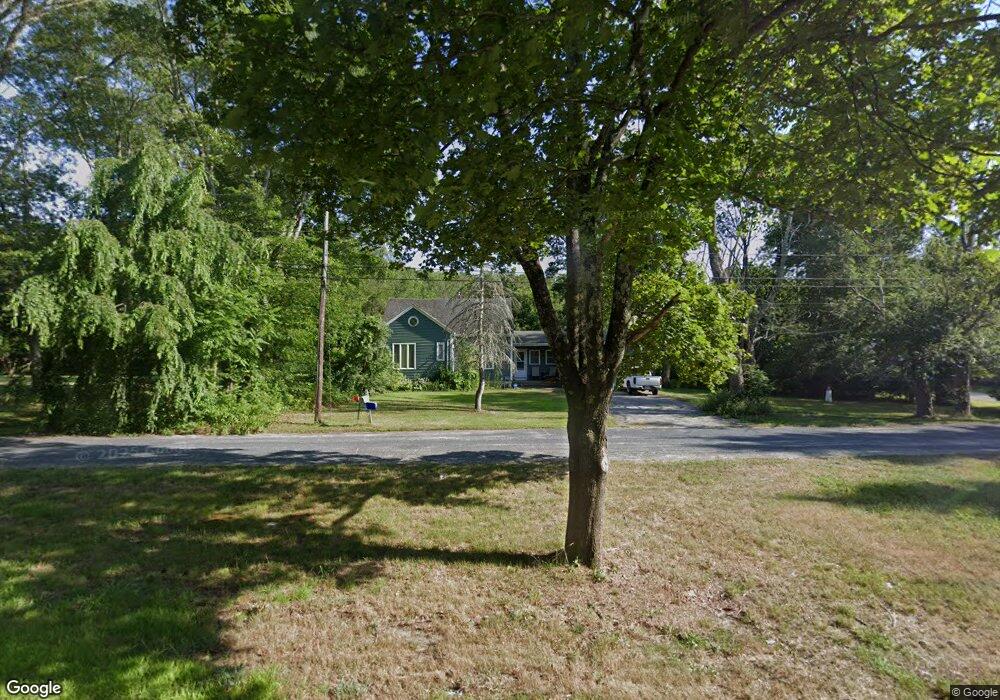
577 Tremont St Rehoboth, MA 02769
Estimated Value: $424,000 - $545,000
2
Beds
1
Bath
1,362
Sq Ft
$348/Sq Ft
Est. Value
About This Home
This home is located at 577 Tremont St, Rehoboth, MA 02769 and is currently estimated at $473,684, approximately $347 per square foot. 577 Tremont St is a home located in Bristol County with nearby schools including Dighton-Rehoboth Regional High School, Grace Baptist Christian Academy, and St Cecilia School.
Ownership History
Date
Name
Owned For
Owner Type
Purchase Details
Closed on
Aug 7, 1991
Sold by
Heureux Teresa L
Bought by
Sardones Ricky B
Current Estimated Value
Home Financials for this Owner
Home Financials are based on the most recent Mortgage that was taken out on this home.
Original Mortgage
$65,000
Interest Rate
9.58%
Mortgage Type
Purchase Money Mortgage
Create a Home Valuation Report for This Property
The Home Valuation Report is an in-depth analysis detailing your home's value as well as a comparison with similar homes in the area
Home Values in the Area
Average Home Value in this Area
Purchase History
| Date | Buyer | Sale Price | Title Company |
|---|---|---|---|
| Sardones Ricky B | $81,500 | -- |
Source: Public Records
Mortgage History
| Date | Status | Borrower | Loan Amount |
|---|---|---|---|
| Open | Sardones Ricky B | $40,000 | |
| Closed | Sardones Ricky B | $67,000 | |
| Closed | Sardones Ricky B | $65,000 | |
| Previous Owner | Sardones Ricky B | $58,000 |
Source: Public Records
Tax History Compared to Growth
Tax History
| Year | Tax Paid | Tax Assessment Tax Assessment Total Assessment is a certain percentage of the fair market value that is determined by local assessors to be the total taxable value of land and additions on the property. | Land | Improvement |
|---|---|---|---|---|
| 2025 | $39 | $346,700 | $176,800 | $169,900 |
| 2024 | $3,522 | $310,000 | $159,500 | $150,500 |
| 2023 | $3,523 | $304,200 | $156,300 | $147,900 |
| 2022 | $3,401 | $268,400 | $156,300 | $112,100 |
| 2021 | $0 | $253,300 | $141,200 | $112,100 |
| 2020 | $3,062 | $233,400 | $125,100 | $108,300 |
| 2018 | $2,693 | $225,000 | $134,600 | $90,400 |
| 2017 | $2,762 | $219,900 | $142,200 | $77,700 |
| 2016 | $2,532 | $208,400 | $134,600 | $73,800 |
| 2015 | $2,812 | $228,400 | $135,800 | $92,600 |
| 2014 | $2,676 | $215,100 | $129,300 | $85,800 |
Source: Public Records
Map
Nearby Homes
- 575 Tremont St
- 574 Tremont St
- 581 Tremont St
- 567 Tremont St
- 570 Tremont St
- 568 Tremont St
- 585 Tremont St
- 565 Tremont St
- 566 Tremont St
- 7 Finnegans Way
- 580 Tremont St
- 579 Tremont St
- 563 Tremont St
- 561 Tremont St
- 584 Tremont St
- 564 Tremont St
- 11 Finnegans Way
- 593 Tremont St
- 588 Tremont St
- 560 Tremont St