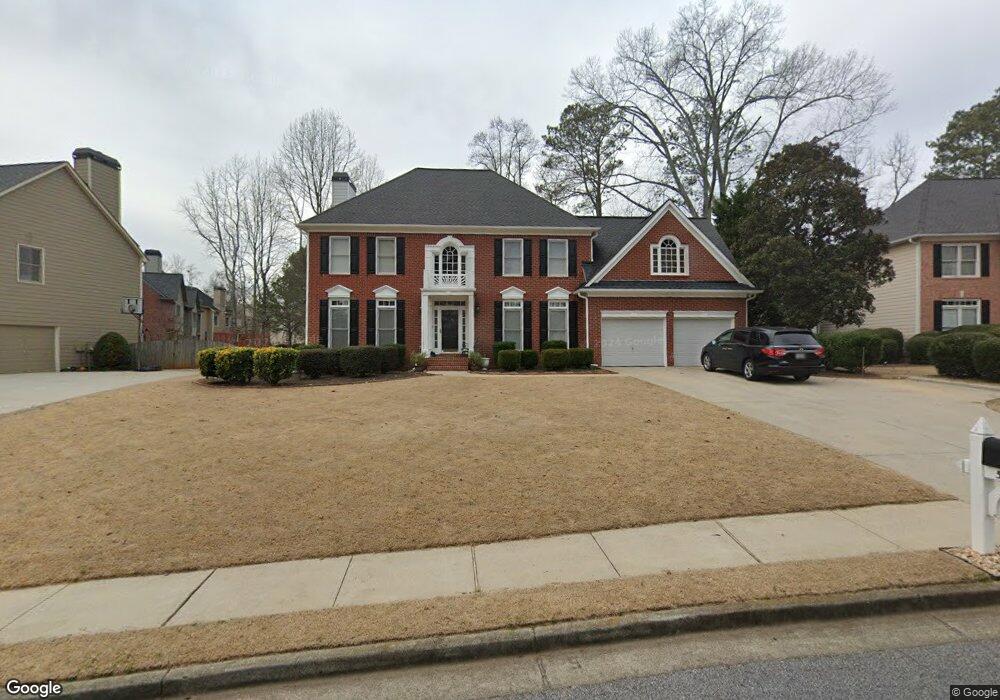
5770 Devonshire Way Cumming, GA 30040
Estimated Value: $669,628 - $763,000
5
Beds
5
Baths
2,821
Sq Ft
$258/Sq Ft
Est. Value
About This Home
This home is located at 5770 Devonshire Way, Cumming, GA 30040 and is currently estimated at $726,907, approximately $257 per square foot. 5770 Devonshire Way is a home located in Forsyth County with nearby schools including Vickery Creek Middle School, Forsyth Central High School, and Creekside Christian Academy.
Ownership History
Date
Name
Owned For
Owner Type
Purchase Details
Closed on
Jun 20, 2008
Sold by
National Resid Nominee Svcs In
Bought by
Patel Tushar A and Patel Mital T
Current Estimated Value
Home Financials for this Owner
Home Financials are based on the most recent Mortgage that was taken out on this home.
Original Mortgage
$294,400
Outstanding Balance
$188,141
Interest Rate
5.97%
Mortgage Type
New Conventional
Estimated Equity
$538,766
Purchase Details
Closed on
Mar 23, 2001
Sold by
Padgett Tommy K
Bought by
Padgett Tommy K and Padgett Melissa
Home Financials for this Owner
Home Financials are based on the most recent Mortgage that was taken out on this home.
Original Mortgage
$230,000
Interest Rate
7.11%
Mortgage Type
New Conventional
Create a Home Valuation Report for This Property
The Home Valuation Report is an in-depth analysis detailing your home's value as well as a comparison with similar homes in the area
Home Values in the Area
Average Home Value in this Area
Purchase History
| Date | Buyer | Sale Price | Title Company |
|---|---|---|---|
| Patel Tushar A | $368,000 | -- | |
| National Resid Nominee Svcs In | $368,000 | -- | |
| Padgett Tommy K | -- | -- | |
| Padgett Tommy K | $290,800 | -- |
Source: Public Records
Mortgage History
| Date | Status | Borrower | Loan Amount |
|---|---|---|---|
| Open | National Resid Nominee Svcs In | $294,400 | |
| Previous Owner | Padgett Tommy K | $230,000 |
Source: Public Records
Tax History Compared to Growth
Tax History
| Year | Tax Paid | Tax Assessment Tax Assessment Total Assessment is a certain percentage of the fair market value that is determined by local assessors to be the total taxable value of land and additions on the property. | Land | Improvement |
|---|---|---|---|---|
| 2025 | $5,403 | $266,732 | $60,000 | $206,732 |
| 2024 | $5,403 | $261,176 | $60,000 | $201,176 |
| 2023 | $5,211 | $269,176 | $60,000 | $209,176 |
| 2022 | $4,478 | $161,932 | $32,000 | $129,932 |
| 2021 | $4,201 | $161,932 | $32,000 | $129,932 |
| 2020 | $4,095 | $156,788 | $34,000 | $122,788 |
| 2019 | $4,080 | $130,236 | $36,000 | $94,236 |
| 2018 | $3,833 | $143,540 | $30,000 | $113,540 |
| 2017 | $3,832 | $142,820 | $30,000 | $112,820 |
| 2016 | $3,654 | $134,820 | $22,000 | $112,820 |
| 2015 | $3,661 | $134,820 | $22,000 | $112,820 |
| 2014 | $3,078 | $119,556 | $0 | $0 |
Source: Public Records
Map
Nearby Homes
- 5990 Wilmington Ct
- 6260 Sturbridge Ln
- 5375 Hedgewick Way
- 5875 Weddington Dr
- 6330 Turfway Dr Unit II
- 5825 Crestwick Way
- 5795 Asby Way
- 4835 Wayt Farm Overlook
- 4775 Wayt Farm Overlook
- 4750 Wayt Farm Overlook
- 4720 Wayt Farm Overlook
- 4770 Wayt Farm Overlook
- 6175 Beaver Crossing Dr
- 6165 Bennett Pkwy
- 5510 Crestwick Way
- 5310 Kings Common Way
- 5780 Devonshire Way Unit I
- 5820 Westcroft Ln Unit 4
- 5760 Devonshire Way Unit 1
- 5940 Worthington Ct Unit 5940
- 5940 Worthington Ct
- 5940 Worthington Ct Unit A
- 5940 Worthington Ct
- 5940 Worthington Ct
- 5950 Worthington Ct
- 5920 Worthington Ct Unit 4
- 5765 Devonshire Way Unit I
- 0 Worthington Ct
- 5810 Devonshire Way Unit 1
- 5805 Devonshire Way
- 5960 Worthington Ct
- 5825 Westcroft Ln
- 5740 Devonshire Way
- 5835 Westcroft Ln
- 5945 Worthington Ct Unit 4
- 5935 Worthington Ct Unit 4