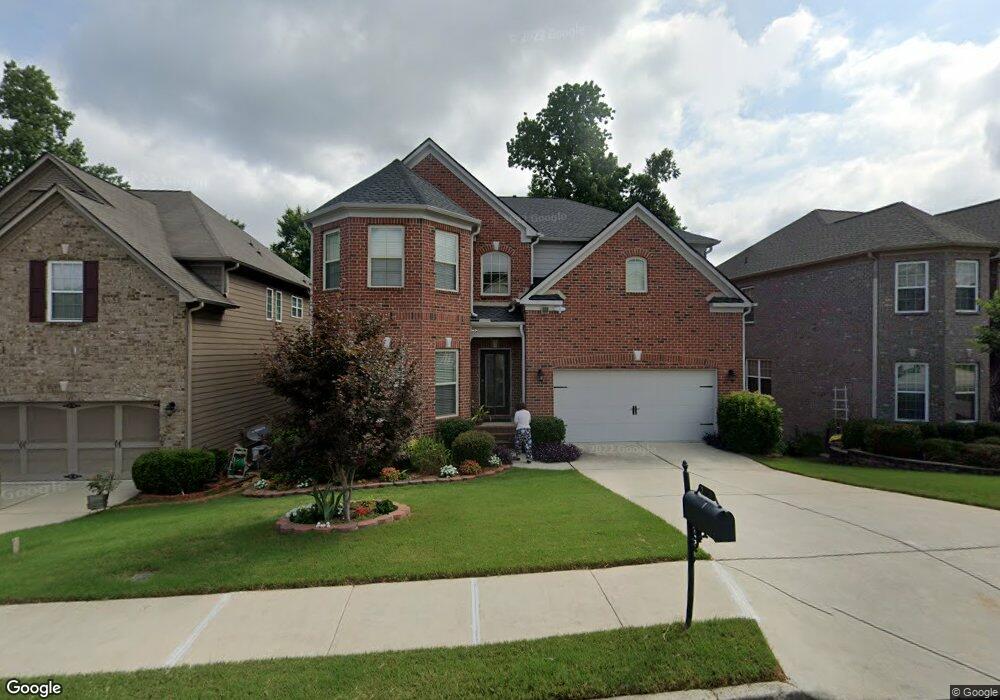
5770 Stow Dr Tucker, GA 30084
Estimated Value: $545,739 - $598,000
4
Beds
4
Baths
3,236
Sq Ft
$176/Sq Ft
Est. Value
About This Home
This home is located at 5770 Stow Dr, Tucker, GA 30084 and is currently estimated at $568,185, approximately $175 per square foot. 5770 Stow Dr is a home with nearby schools including Arcado Elementary School, Trickum Middle School, and Parkview High School.
Ownership History
Date
Name
Owned For
Owner Type
Purchase Details
Closed on
May 25, 2010
Sold by
Ryland Group Inc
Bought by
Guo Xiuchan and Li Ji
Current Estimated Value
Home Financials for this Owner
Home Financials are based on the most recent Mortgage that was taken out on this home.
Original Mortgage
$236,782
Interest Rate
5.03%
Mortgage Type
New Conventional
Purchase Details
Closed on
Jan 29, 2010
Sold by
Piedmont Investments 2 Llc
Bought by
Ryland Group Inc
Create a Home Valuation Report for This Property
The Home Valuation Report is an in-depth analysis detailing your home's value as well as a comparison with similar homes in the area
Home Values in the Area
Average Home Value in this Area
Purchase History
| Date | Buyer | Sale Price | Title Company |
|---|---|---|---|
| Guo Xiuchan | $296,000 | -- | |
| Ryland Group Inc | $407,700 | -- |
Source: Public Records
Mortgage History
| Date | Status | Borrower | Loan Amount |
|---|---|---|---|
| Closed | Guo Xiuchan | $236,782 |
Source: Public Records
Tax History Compared to Growth
Tax History
| Year | Tax Paid | Tax Assessment Tax Assessment Total Assessment is a certain percentage of the fair market value that is determined by local assessors to be the total taxable value of land and additions on the property. | Land | Improvement |
|---|---|---|---|---|
| 2025 | $3,921 | $220,480 | $36,000 | $184,480 |
| 2024 | $6,511 | $220,480 | $36,000 | $184,480 |
| 2023 | $6,511 | $220,480 | $36,000 | $184,480 |
| 2022 | $0 | $152,400 | $26,800 | $125,600 |
| 2021 | $5,161 | $169,200 | $26,800 | $142,400 |
| 2020 | $4,734 | $169,200 | $26,800 | $142,400 |
| 2019 | $4,571 | $131,000 | $22,400 | $108,600 |
| 2018 | $4,579 | $131,000 | $22,400 | $108,600 |
| 2016 | $4,725 | $136,760 | $18,400 | $118,360 |
| 2015 | $4,518 | $125,000 | $18,400 | $106,600 |
| 2014 | $4,543 | $125,000 | $18,400 | $106,600 |
Source: Public Records
Map
Nearby Homes