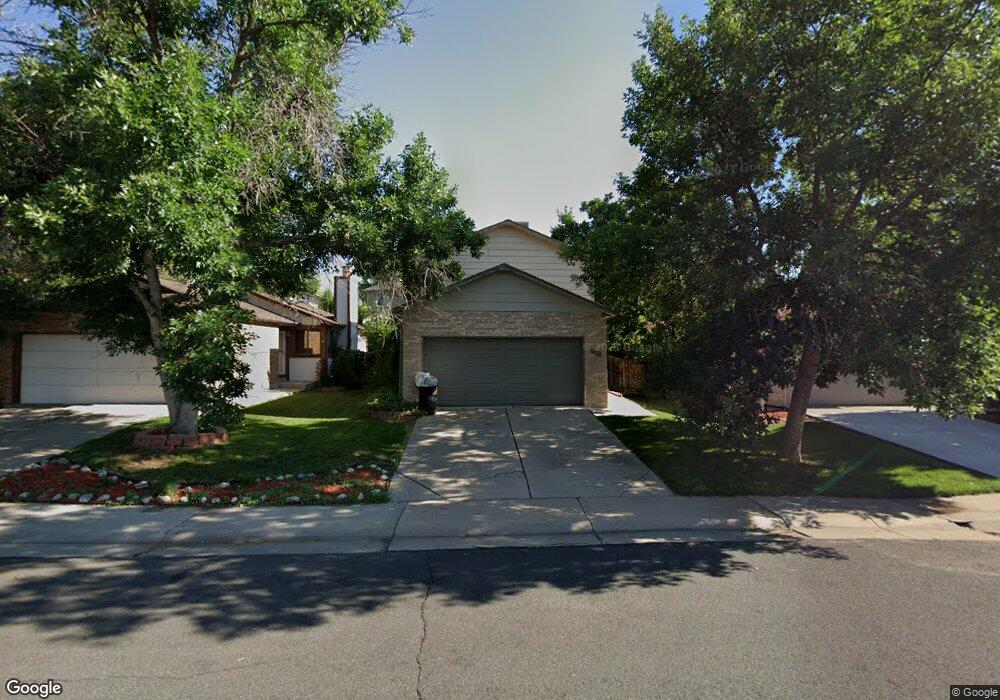
5771 W 71st Ave Arvada, CO 80003
Shoenberg Farms NeighborhoodEstimated Value: $493,000 - $506,000
3
Beds
5
Baths
1,222
Sq Ft
$407/Sq Ft
Est. Value
About This Home
This home is located at 5771 W 71st Ave, Arvada, CO 80003 and is currently estimated at $497,582, approximately $407 per square foot. 5771 W 71st Ave is a home located in Jefferson County with nearby schools including Swanson Elementary School, North Arvada Middle School, and Arvada High School.
Ownership History
Date
Name
Owned For
Owner Type
Purchase Details
Closed on
Mar 23, 2005
Sold by
Callaway Christopher S
Bought by
Callaway Christopher S and Callaway Christina
Current Estimated Value
Home Financials for this Owner
Home Financials are based on the most recent Mortgage that was taken out on this home.
Original Mortgage
$157,600
Outstanding Balance
$80,797
Interest Rate
5.78%
Mortgage Type
New Conventional
Estimated Equity
$416,785
Purchase Details
Closed on
Dec 12, 2000
Sold by
Hoover Douglas L Hoover Anita L
Bought by
Callaway Christopher S
Home Financials for this Owner
Home Financials are based on the most recent Mortgage that was taken out on this home.
Original Mortgage
$166,250
Interest Rate
7.72%
Purchase Details
Closed on
Sep 2, 1993
Sold by
Weiss Duane A
Bought by
Hoover Douglas L and Hoover Anita L
Home Financials for this Owner
Home Financials are based on the most recent Mortgage that was taken out on this home.
Original Mortgage
$89,100
Interest Rate
7.23%
Mortgage Type
VA
Create a Home Valuation Report for This Property
The Home Valuation Report is an in-depth analysis detailing your home's value as well as a comparison with similar homes in the area
Home Values in the Area
Average Home Value in this Area
Purchase History
| Date | Buyer | Sale Price | Title Company |
|---|---|---|---|
| Callaway Christopher S | -- | Nations Title Agency | |
| Callaway Christopher S | $175,000 | -- | |
| Hoover Douglas L | $88,000 | -- |
Source: Public Records
Mortgage History
| Date | Status | Borrower | Loan Amount |
|---|---|---|---|
| Open | Callaway Christopher S | $157,600 | |
| Closed | Callaway Christopher S | $166,250 | |
| Previous Owner | Hoover Douglas L | $89,100 | |
| Closed | Callaway Christopher S | $25,500 |
Source: Public Records
Tax History
| Year | Tax Paid | Tax Assessment Tax Assessment Total Assessment is a certain percentage of the fair market value that is determined by local assessors to be the total taxable value of land and additions on the property. | Land | Improvement |
|---|---|---|---|---|
| 2024 | $2,081 | $27,328 | $11,232 | $16,096 |
| 2023 | $2,081 | $27,328 | $11,232 | $16,096 |
| 2022 | $1,886 | $24,254 | $10,361 | $13,893 |
| 2021 | $1,914 | $24,952 | $10,659 | $14,293 |
| 2020 | $1,660 | $21,762 | $5,818 | $15,944 |
| 2019 | $1,633 | $21,762 | $5,818 | $15,944 |
| 2018 | $1,380 | $17,778 | $3,925 | $13,853 |
| 2017 | $1,236 | $17,778 | $3,925 | $13,853 |
| 2016 | $1,212 | $16,183 | $4,522 | $11,661 |
| 2015 | $1,034 | $16,183 | $4,522 | $11,661 |
| 2014 | $1,034 | $12,871 | $4,012 | $8,859 |
Source: Public Records
Map
Nearby Homes
- 5720 W 71st Ave
- 5670 W 71st Ave
- 6207 W 71st Ave
- 5555 W 69th Ave
- 6340 W 70th Dr
- 6317 W 71st Ave
- 5549 W 72nd Place
- 6172 W 68th Ave
- 5580 W 73rd Ave
- 7363 Chase St
- 6646 Fenton St
- 5730 W 74th Ave
- 6650 Depew Ct
- 7028 Otis Ct
- 5244 W 68th Ave Unit 5244
- 6769 W 70th Ave
- 6610 Depew Ct
- 5320 W 67th Ave
- 6441 W 73rd Place
- 7104 Yates St
- 5781 W 71st Ave
- 5751 W 71st Ave
- 5766 W 71st Place
- 5791 W 71st Ave
- 5762 W 71st Place
- 5747 W 71st Ave
- 5752 W 71st Place
- 5797 W 71st Ave
- 5772 W 71st Place
- 5760 W 71st Ave
- 5750 W 71st Ave
- 5768 W 71st Ave
- 5748 W 71st Place
- 5741 W 71st Ave
- 5746 W 71st Ave
- 5770 W 71st Ave
- 7100 Fenton Cir
- 5740 W 71st Ave
- 5742 W 71st Place
- 7110 Fenton Cir
Your Personal Tour Guide
Ask me questions while you tour the home.