Estimated Value: $199,000 - $361,000
3
Beds
1
Bath
2,128
Sq Ft
$134/Sq Ft
Est. Value
About This Home
This home is located at 5775 N 210 W, Howe, IN 46746 and is currently estimated at $285,572, approximately $134 per square foot. 5775 N 210 W is a home located in LaGrange County with nearby schools including Lakeland Jr/Sr High School, Indian Trail School, and Southeast Clay School.
Ownership History
Date
Name
Owned For
Owner Type
Purchase Details
Closed on
Feb 28, 2018
Sold by
Obrien James A and Obrien Amy S
Bought by
Klee Richard F
Current Estimated Value
Home Financials for this Owner
Home Financials are based on the most recent Mortgage that was taken out on this home.
Original Mortgage
$180,000
Outstanding Balance
$153,396
Interest Rate
4.15%
Mortgage Type
New Conventional
Estimated Equity
$132,176
Purchase Details
Closed on
Mar 18, 2010
Sold by
Peggy S Burke
Bought by
Brien Amy O and Brien James O
Create a Home Valuation Report for This Property
The Home Valuation Report is an in-depth analysis detailing your home's value as well as a comparison with similar homes in the area
Home Values in the Area
Average Home Value in this Area
Purchase History
| Date | Buyer | Sale Price | Title Company |
|---|---|---|---|
| Klee Richard F | $225,100 | Fidelity National Title Co | |
| Brien Amy O | $199,000 | Lakeland Title |
Source: Public Records
Mortgage History
| Date | Status | Borrower | Loan Amount |
|---|---|---|---|
| Open | Klee Richard F | $180,000 |
Source: Public Records
Tax History Compared to Growth
Tax History
| Year | Tax Paid | Tax Assessment Tax Assessment Total Assessment is a certain percentage of the fair market value that is determined by local assessors to be the total taxable value of land and additions on the property. | Land | Improvement |
|---|---|---|---|---|
| 2024 | $2,134 | $236,100 | $149,800 | $86,300 |
| 2023 | $2,107 | $229,500 | $145,500 | $84,000 |
| 2022 | $2,172 | $224,300 | $141,200 | $83,100 |
| 2021 | $1,911 | $214,900 | $141,200 | $73,700 |
| 2020 | $2,129 | $217,000 | $150,600 | $66,400 |
| 2019 | $2,186 | $216,700 | $150,600 | $66,100 |
| 2018 | $2,202 | $207,000 | $143,500 | $63,500 |
| 2017 | $2,066 | $193,000 | $133,000 | $60,000 |
| 2016 | $2,056 | $195,100 | $133,000 | $62,100 |
| 2014 | $2,005 | $192,600 | $133,000 | $59,600 |
| 2013 | $2,005 | $223,100 | $153,400 | $69,700 |
Source: Public Records
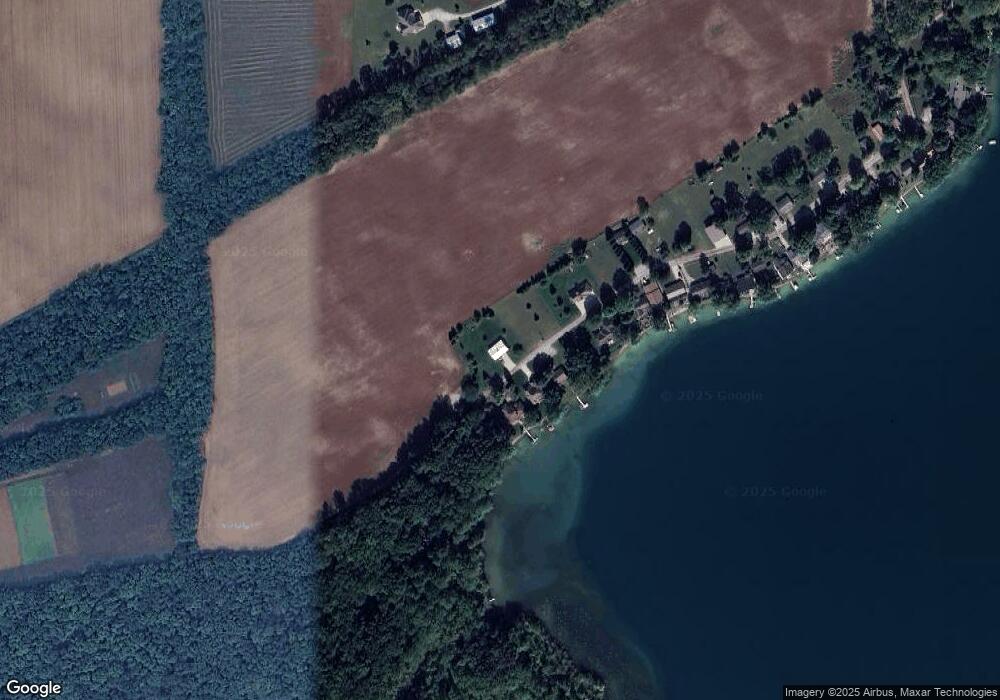
Map
Nearby Homes