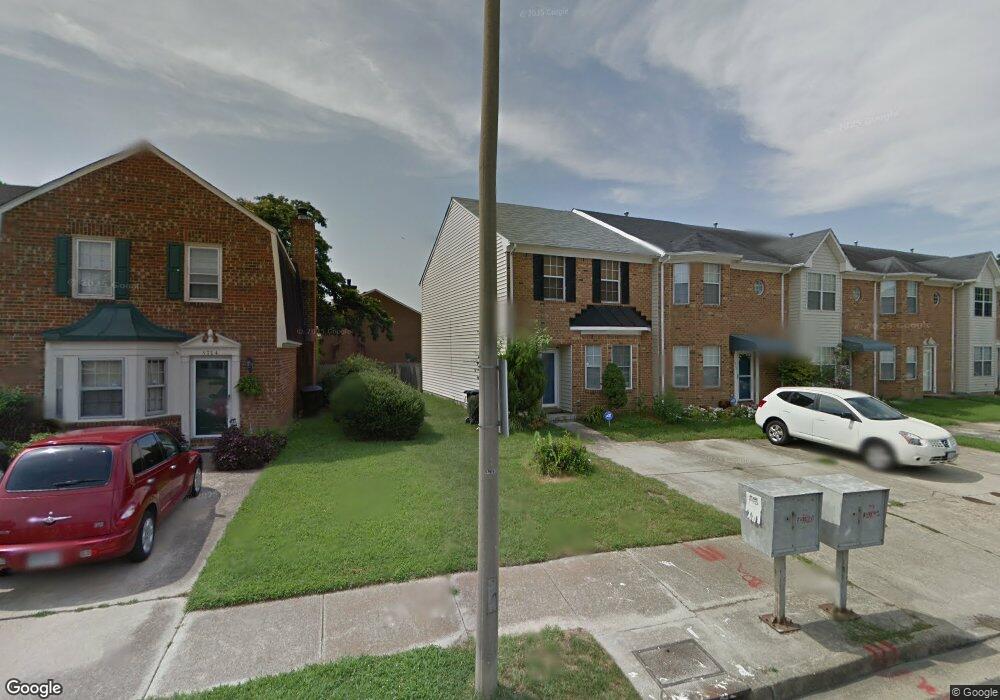
5776 Rivermill Cir Portsmouth, VA 23703
Churchland NeighborhoodEstimated Value: $183,000 - $247,000
3
Beds
3
Baths
1,527
Sq Ft
$146/Sq Ft
Est. Value
About This Home
This home is located at 5776 Rivermill Cir, Portsmouth, VA 23703 and is currently estimated at $223,243, approximately $146 per square foot. 5776 Rivermill Cir is a home located in Portsmouth City with nearby schools including Churchland Primary/Intermediate School, Churchland Middle School, and Churchland High School.
Ownership History
Date
Name
Owned For
Owner Type
Purchase Details
Closed on
Feb 15, 2024
Sold by
Smith Adrienne Christina and Smith Adrienne C
Bought by
Adrienne Christina Smith Revocable Trust and Smith
Current Estimated Value
Purchase Details
Closed on
May 18, 2018
Sold by
The Secretary Of Housing And Urban Devel
Bought by
Smith Adrienne C
Home Financials for this Owner
Home Financials are based on the most recent Mortgage that was taken out on this home.
Original Mortgage
$85,000
Interest Rate
4.4%
Mortgage Type
New Conventional
Purchase Details
Closed on
Oct 17, 2017
Sold by
Brian Dolan Law Offices Pllc and Garland David N
Bought by
The Secretary Of The Us Department Of Ho
Purchase Details
Closed on
Jun 8, 2012
Sold by
Williams Kim R
Bought by
Garland David N
Home Financials for this Owner
Home Financials are based on the most recent Mortgage that was taken out on this home.
Original Mortgage
$88,369
Interest Rate
4.4%
Mortgage Type
FHA
Create a Home Valuation Report for This Property
The Home Valuation Report is an in-depth analysis detailing your home's value as well as a comparison with similar homes in the area
Home Values in the Area
Average Home Value in this Area
Purchase History
| Date | Buyer | Sale Price | Title Company |
|---|---|---|---|
| Adrienne Christina Smith Revocable Trust | -- | None Listed On Document | |
| Smith Adrienne C | $100,000 | Attorney | |
| The Secretary Of The Us Department Of Ho | $88,500 | None Available | |
| Garland David N | $90,000 | -- |
Source: Public Records
Mortgage History
| Date | Status | Borrower | Loan Amount |
|---|---|---|---|
| Previous Owner | Smith Adrienne C | $85,000 | |
| Previous Owner | Garland David N | $88,369 |
Source: Public Records
Tax History Compared to Growth
Tax History
| Year | Tax Paid | Tax Assessment Tax Assessment Total Assessment is a certain percentage of the fair market value that is determined by local assessors to be the total taxable value of land and additions on the property. | Land | Improvement |
|---|---|---|---|---|
| 2025 | $2,408 | $196,300 | $48,000 | $148,300 |
| 2024 | $2,408 | $181,900 | $45,000 | $136,900 |
| 2023 | $2,131 | $170,490 | $45,000 | $125,490 |
| 2022 | $2,126 | $163,550 | $40,000 | $123,550 |
| 2021 | $1,892 | $145,550 | $22,000 | $123,550 |
| 2020 | $1,819 | $139,930 | $22,000 | $117,930 |
| 2019 | $1,707 | $131,320 | $19,000 | $112,320 |
| 2018 | $1,665 | $128,070 | $17,810 | $110,260 |
| 2017 | $1,665 | $128,070 | $17,810 | $110,260 |
| 2016 | $1,665 | $128,070 | $17,810 | $110,260 |
| 2015 | $1,665 | $128,060 | $17,810 | $110,250 |
| 2014 | $1,700 | $133,870 | $17,810 | $116,060 |
Source: Public Records
Map
Nearby Homes
- 5693 Rivermill Cir
- 5728 Hawthorne Ln
- 5606 Gregory Ct
- 4444 Southampton Arch
- 4232 Summerset Dr
- 5833 Hawthorne Ln
- 4619 River Shore Rd
- 4224 Burnham Dr
- 21 Windy Pines Crescent
- 4200 Quince Rd
- 4028 Swannanoa Dr
- 4726 River Shore Rd
- 8 Compass Ct
- 5807 Dunkin St
- 4100 Mayfair Way
- 4008 Oakhurst Rd
- 17 Shoal Ct
- 4071 Long Point Blvd
- 3433 Willow Breeze Dr
- 6750 Burbage Landing Cir
- 5778 Rivermill Cir
- 5774 Rivermill Cir
- 5780 Rivermill Cir
- 5772 Rivermill Cir
- 5782 Rivermill Cir
- 5770 Rivermill Cir
- 4437 River Shore Rd
- 5784 Rivermill Cir
- 5768 Rivermill Cir
- 4435 River Shore Rd
- 5766 Rivermill Cir
- 5786 Rivermill Cir
- 4433 River Shore Rd
- 5764 Rivermill Cir
- 4431 River Shore Rd
- 5783 Rivermill Cir
- 5762 Rivermill Cir
- 5781 Rivermill Cir
- 5785 Rivermill Cir
- 5779 Rivermill Cir