Estimated Value: $644,000 - $775,000
4
Beds
3
Baths
2,692
Sq Ft
$258/Sq Ft
Est. Value
About This Home
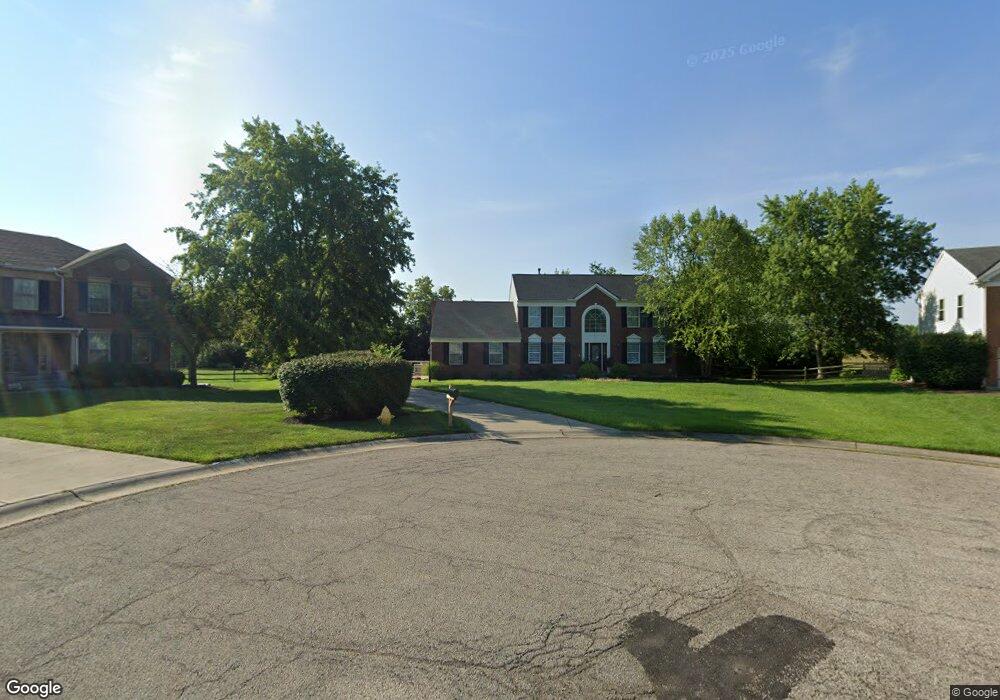
This home is located at 5777 Grazing Ct, Mason, OH 45040 and is currently estimated at $693,192, approximately $257 per square foot. 5777 Grazing Ct is a home located in Warren County with nearby schools including Mason Intermediate Elementary School, Mason Middle School, and William Mason High School.
Ownership History
Date
Name
Owned For
Owner Type
Purchase Details
Closed on
Nov 5, 2024
Sold by
Parpart Tracy A
Bought by
Pearson Timothy P and Broman Sarah E
Current Estimated Value
Home Financials for this Owner
Home Financials are based on the most recent Mortgage that was taken out on this home.
Original Mortgage
$540,000
Outstanding Balance
$531,771
Interest Rate
6.08%
Mortgage Type
New Conventional
Estimated Equity
$161,421
Purchase Details
Closed on
Jun 10, 1996
Sold by
Werner Theodore J
Bought by
Parpart Tracy A
Home Financials for this Owner
Home Financials are based on the most recent Mortgage that was taken out on this home.
Original Mortgage
$153,000
Interest Rate
7.97%
Mortgage Type
New Conventional
Purchase Details
Closed on
Feb 16, 1994
Sold by
Zaring Homes & Inc
Bought by
Werner and Werner Theodore J
Purchase Details
Closed on
Nov 18, 1993
Sold by
Campbell-Rhein Developmen
Bought by
Zaring Homes & Inc.
Purchase Details
Closed on
Aug 27, 1993
Sold by
Campbell-Rhein Developmen
Bought by
Campbell-Rhein Developmen
Create a Home Valuation Report for This Property
The Home Valuation Report is an in-depth analysis detailing your home's value as well as a comparison with similar homes in the area
Home Values in the Area
Average Home Value in this Area
Purchase History
| Date | Buyer | Sale Price | Title Company |
|---|---|---|---|
| Pearson Timothy P | $675,000 | None Listed On Document | |
| Parpart Tracy A | $204,000 | -- | |
| Werner | $193,200 | -- | |
| Zaring Homes & Inc. | -- | -- | |
| Campbell-Rhein Developmen | -- | -- |
Source: Public Records
Mortgage History
| Date | Status | Borrower | Loan Amount |
|---|---|---|---|
| Open | Pearson Timothy P | $540,000 | |
| Previous Owner | Parpart Tracy A | $153,000 |
Source: Public Records
Tax History
| Year | Tax Paid | Tax Assessment Tax Assessment Total Assessment is a certain percentage of the fair market value that is determined by local assessors to be the total taxable value of land and additions on the property. | Land | Improvement |
|---|---|---|---|---|
| 2025 | $7,348 | $180,900 | $42,000 | $138,900 |
| 2024 | $7,348 | $180,900 | $42,000 | $138,900 |
| 2023 | $6,854 | $142,485 | $24,360 | $118,125 |
| 2022 | $6,765 | $142,485 | $24,360 | $118,125 |
| 2021 | $6,409 | $142,485 | $24,360 | $118,125 |
| 2020 | $6,445 | $122,833 | $21,000 | $101,833 |
| 2019 | $5,926 | $122,833 | $21,000 | $101,833 |
| 2018 | $5,945 | $122,833 | $21,000 | $101,833 |
| 2017 | $4,765 | $91,868 | $11,393 | $80,476 |
| 2016 | $4,908 | $91,868 | $11,393 | $80,476 |
| 2015 | $4,919 | $91,868 | $11,393 | $80,476 |
| 2014 | $4,795 | $83,520 | $10,360 | $73,160 |
| 2013 | $4,806 | $98,780 | $12,250 | $86,530 |
Source: Public Records
Map
Nearby Homes
- 600 W Church St
- 3 Carnell Place
- 5104 Lexington Ct
- 4853 Sandalwood Ct
- 5496 Red Fox Ct
- 5271 Harvestdale Dr
- 5615 Wheatmore Ct
- 217 E Circle Dr
- 4943 Isaac Ln
- 6306 Caddies Way
- 5239 Concord Crossing Dr
- 5173 Franklin Park St
- 4922 Bordeaux Ln Unit 4922
- 5130 Franklin Park St
- 4734 Margaret Ct
- 4782 Bordeaux Ln
- 4585 Corner Stone Ct
- 6246 Lake Springs
- 5641 Richmond Park Dr
- 607 Tylersville Rd
- 5769 Grazing Ct
- 5791 Grazing Ct
- 5772 Grazing Ct
- 5811 Grazing Ct
- 5788 Grazing Ct
- 5808 Grazing Ct
- 5829 Grazing Ct
- 5098 Birchwood Farms Dr
- 5826 Grazing Ct
- 5104 Birchwood Farms Dr
- 5849 Grazing Ct
- 5116 Birchwood Farms Dr
- 5529 Mason Rd
- 5092 Birchwood Farms Dr
- 5844 Grazing Ct
- 5126 Birchwood Farms Dr
- 5082 Birchwood Farms Dr
- 5873 Grazing Ct
- 5535 Mason Rd
- 5136 Birchwood Farms Dr
Your Personal Tour Guide
Ask me questions while you tour the home.