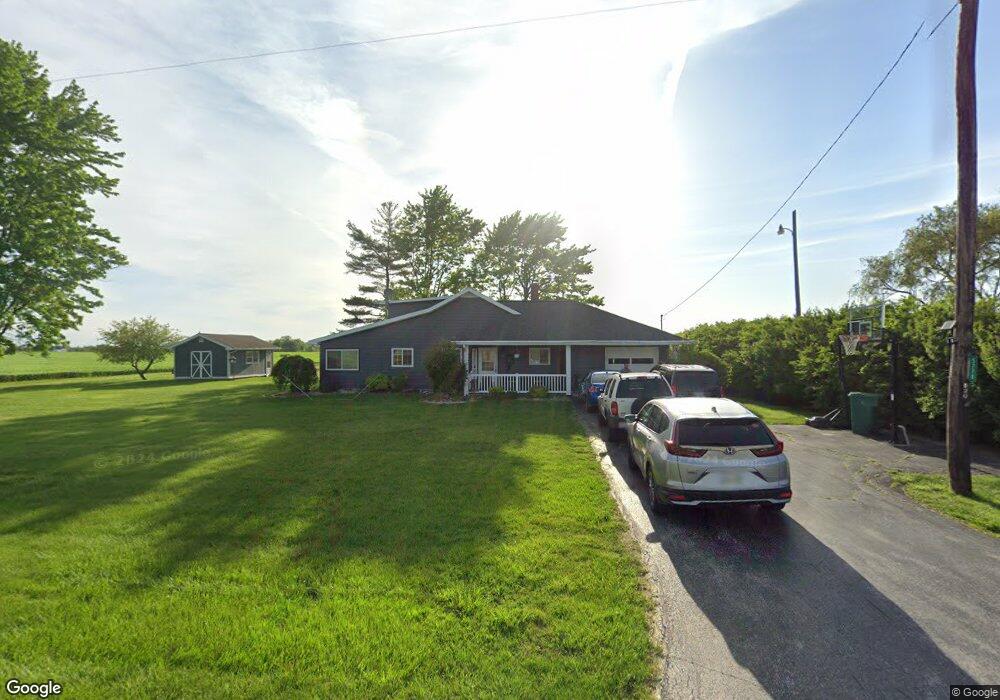
5778 N Reiman Rd Curtice, OH 43412
Estimated Value: $193,000 - $268,000
4
Beds
1
Bath
1,759
Sq Ft
$134/Sq Ft
Est. Value
About This Home
This home is located at 5778 N Reiman Rd, Curtice, OH 43412 and is currently estimated at $236,426, approximately $134 per square foot. 5778 N Reiman Rd is a home located in Ottawa County with nearby schools including Genoa Elementary School.
Ownership History
Date
Name
Owned For
Owner Type
Purchase Details
Closed on
Jan 12, 2024
Sold by
Jackson Lindsay
Bought by
Jackson Jeremy
Current Estimated Value
Purchase Details
Closed on
Dec 13, 2019
Sold by
Orians Rob W and Orians Kristen R
Bought by
Jackson Jeremy and Jackson Lindsay
Home Financials for this Owner
Home Financials are based on the most recent Mortgage that was taken out on this home.
Original Mortgage
$138,445
Interest Rate
4.12%
Mortgage Type
FHA
Purchase Details
Closed on
Apr 8, 2016
Sold by
Orians Rob W and Orians Kristen R
Bought by
Orians Rob W and Orians Kristen R
Purchase Details
Closed on
Mar 6, 2015
Sold by
Rohloff Bertha R and Rohloff Jonathan D
Bought by
Orians Rob W
Home Financials for this Owner
Home Financials are based on the most recent Mortgage that was taken out on this home.
Original Mortgage
$70,000
Interest Rate
3.64%
Mortgage Type
Future Advance Clause Open End Mortgage
Create a Home Valuation Report for This Property
The Home Valuation Report is an in-depth analysis detailing your home's value as well as a comparison with similar homes in the area
Home Values in the Area
Average Home Value in this Area
Purchase History
| Date | Buyer | Sale Price | Title Company |
|---|---|---|---|
| Jackson Jeremy | -- | None Listed On Document | |
| Jackson Jeremy | $141,000 | None Available | |
| Orians Rob W | -- | Attorney | |
| Orians Rob W | $82,500 | Attorney |
Source: Public Records
Mortgage History
| Date | Status | Borrower | Loan Amount |
|---|---|---|---|
| Previous Owner | Jackson Jeremy | $138,445 | |
| Previous Owner | Orians Rob W | $70,000 |
Source: Public Records
Tax History Compared to Growth
Tax History
| Year | Tax Paid | Tax Assessment Tax Assessment Total Assessment is a certain percentage of the fair market value that is determined by local assessors to be the total taxable value of land and additions on the property. | Land | Improvement |
|---|---|---|---|---|
| 2024 | $2,414 | $54,471 | $9,433 | $45,038 |
| 2023 | $2,414 | $42,858 | $8,201 | $34,657 |
| 2022 | $2,152 | $42,858 | $8,201 | $34,657 |
| 2021 | $1,894 | $42,860 | $8,200 | $34,660 |
| 2020 | $1,802 | $38,810 | $5,660 | $33,150 |
| 2019 | $1,787 | $38,810 | $5,660 | $33,150 |
| 2018 | $1,721 | $38,810 | $5,660 | $33,150 |
| 2017 | $1,611 | $34,380 | $5,150 | $29,230 |
| 2016 | $1,617 | $34,380 | $5,150 | $29,230 |
| 2015 | $1,213 | $34,380 | $5,150 | $29,230 |
| 2014 | $1,058 | $32,920 | $5,150 | $27,770 |
| 2013 | $1,058 | $32,920 | $5,150 | $27,770 |
Source: Public Records
Map
Nearby Homes
- 23746 W State Route 579
- 24181 W James Ridge Rd
- 22059 W Bittersweet Ln
- 6927 N Wildacre Rd
- 24125 W Walbridge Rd
- 5555 Brown Rd
- 0 W Walbridge Rd
- Track 1 W Walbridge Rd
- 19367 W Walbridge Rd
- 19395 W Walbridge Rd
- 19433 W Walbridge Rd
- 19481 W Walbridge Rd
- 7330 Jerusalem Rd
- 23385 W Moline Martin Rd
- 30246 Bradner Rd
- 730 Bradner Rd
- 29411 Mabel St
- 28940 Main St
- 4777 Williston Rd
- 28650 Cedar Ln
- 5796 N Reiman Rd
- 5888 N Reiman Rd
- 5881 N Reiman Rd
- 5915 N Reiman Rd
- 23246 W State Route 579
- 23109 W Reiman Rd
- 23258 W State Route 579
- 23137 W Reiman Rd
- 23055 W Reiman Rd
- 23241 W State Route 579
- 0 Ohio 579
- 23284 W State Route 579
- 6059 N Reiman Rd
- 23326 W State Route 579
- 6127 N Reiman Rd
- 22730 W State Route 579
- 23354 W State Route 579
- 22689 W State Route 579
- 23429 W State Route 579
- 22660 W State Route 579