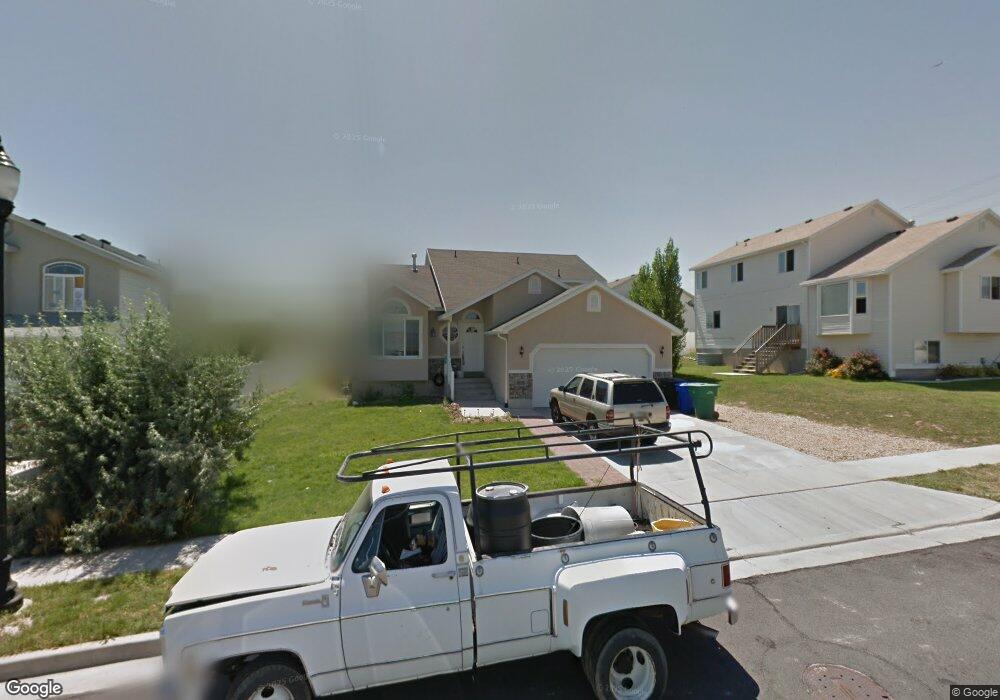
5779 W 6750 S West Jordan, UT 84081
Oquirrh NeighborhoodEstimated Value: $540,000 - $574,000
4
Beds
3
Baths
2,472
Sq Ft
$226/Sq Ft
Est. Value
About This Home
This home is located at 5779 W 6750 S, West Jordan, UT 84081 and is currently estimated at $557,871, approximately $225 per square foot. 5779 W 6750 S is a home located in Salt Lake County with nearby schools including Falcon Ridge School, Sunset Ridge Middle School, and Copper Hills High School.
Ownership History
Date
Name
Owned For
Owner Type
Purchase Details
Closed on
Jun 27, 2006
Sold by
Deng Saoraoth
Bought by
Guzman Octavio
Current Estimated Value
Home Financials for this Owner
Home Financials are based on the most recent Mortgage that was taken out on this home.
Original Mortgage
$22,970
Outstanding Balance
$13,648
Interest Rate
6.57%
Mortgage Type
Credit Line Revolving
Estimated Equity
$544,223
Purchase Details
Closed on
May 30, 2006
Sold by
Din Soeurm Samantha
Bought by
Deng Saoraoth
Home Financials for this Owner
Home Financials are based on the most recent Mortgage that was taken out on this home.
Original Mortgage
$22,970
Outstanding Balance
$13,648
Interest Rate
6.57%
Mortgage Type
Credit Line Revolving
Estimated Equity
$544,223
Purchase Details
Closed on
Jun 19, 2003
Sold by
Home Center Construction Co Llc
Bought by
Deng Saoraoth and Din Soeurm Samantha
Home Financials for this Owner
Home Financials are based on the most recent Mortgage that was taken out on this home.
Original Mortgage
$173,477
Interest Rate
5.53%
Mortgage Type
FHA
Create a Home Valuation Report for This Property
The Home Valuation Report is an in-depth analysis detailing your home's value as well as a comparison with similar homes in the area
Home Values in the Area
Average Home Value in this Area
Purchase History
| Date | Buyer | Sale Price | Title Company |
|---|---|---|---|
| Guzman Octavio | -- | Gt Title Service | |
| Deng Saoraoth | -- | Gt Title Service | |
| Deng Saoraoth | -- | Merrill Title | |
| Home Center Construction Co Llc | -- | Merrill Title |
Source: Public Records
Mortgage History
| Date | Status | Borrower | Loan Amount |
|---|---|---|---|
| Open | Guzman Octavio | $22,970 | |
| Open | Guzman Octavio | $184,000 | |
| Previous Owner | Deng Saoraoth | $173,477 |
Source: Public Records
Tax History Compared to Growth
Tax History
| Year | Tax Paid | Tax Assessment Tax Assessment Total Assessment is a certain percentage of the fair market value that is determined by local assessors to be the total taxable value of land and additions on the property. | Land | Improvement |
|---|---|---|---|---|
| 2025 | $2,943 | $522,300 | $150,000 | $372,300 |
| 2024 | $2,943 | $497,500 | $144,200 | $353,300 |
| 2023 | $2,968 | $471,400 | $138,700 | $332,700 |
| 2022 | $3,128 | $493,800 | $136,000 | $357,800 |
| 2021 | $2,739 | $401,500 | $104,600 | $296,900 |
| 2020 | $2,488 | $340,600 | $97,000 | $243,600 |
| 2019 | $2,428 | $325,100 | $91,500 | $233,600 |
| 2018 | $2,277 | $300,800 | $91,500 | $209,300 |
| 2017 | $2,168 | $282,200 | $91,500 | $190,700 |
| 2016 | $2,188 | $268,000 | $84,700 | $183,300 |
| 2015 | $2,013 | $237,800 | $94,900 | $142,900 |
| 2014 | $1,964 | $227,900 | $92,100 | $135,800 |
Source: Public Records
Map
Nearby Homes
- 5732 W Moon Crest Ct
- 6739 S Sol Rise Dr
- 6838 Discovery Ct
- 6778 Turnstone Ct
- 5961 W Chiswick Ct
- 6680 S Leichen Ct
- 5581 Bluevail Ct
- 5882 W 7000 S
- 5508 W 6635 S
- 6123 August Ln
- 6116 W Graceland Way
- 6922 Mullien Dr
- 6705 S High Bluff Dr
- 7134 S Rialto Way
- 6470 S Wakefield Way
- 6806 Duchess St
- 7259 W Cibola Rd
- 6853 Mullien Dr
- 6969 S High Bluff Dr
- 6892 S Willowpond Way
- 5771 W 6750 S
- 6761 S Dawn Vista Rd
- 6773 S Dawn Vista Rd
- 6773 Dawn Vista Rd
- 6761 Dawn Vista Rd
- 5784 W Dawn Vista Rd
- 5784 Dawn Vista Rd
- 5761 W 6750 S
- 5774 W Dawn Vista Rd
- 5774 Dawn Vista Rd
- 6785 Dawn Vista Rd
- 5782 W 6750 S
- 5772 W 6750 S
- 5762 Dawn Vista Rd
- 5792 W 6750 S
- 6760 S Adventure Way
- 5764 W 6750 S
- 6760 Adventure Way
- 6772 Adventure Way
- 5754 Dawn Vista Rd