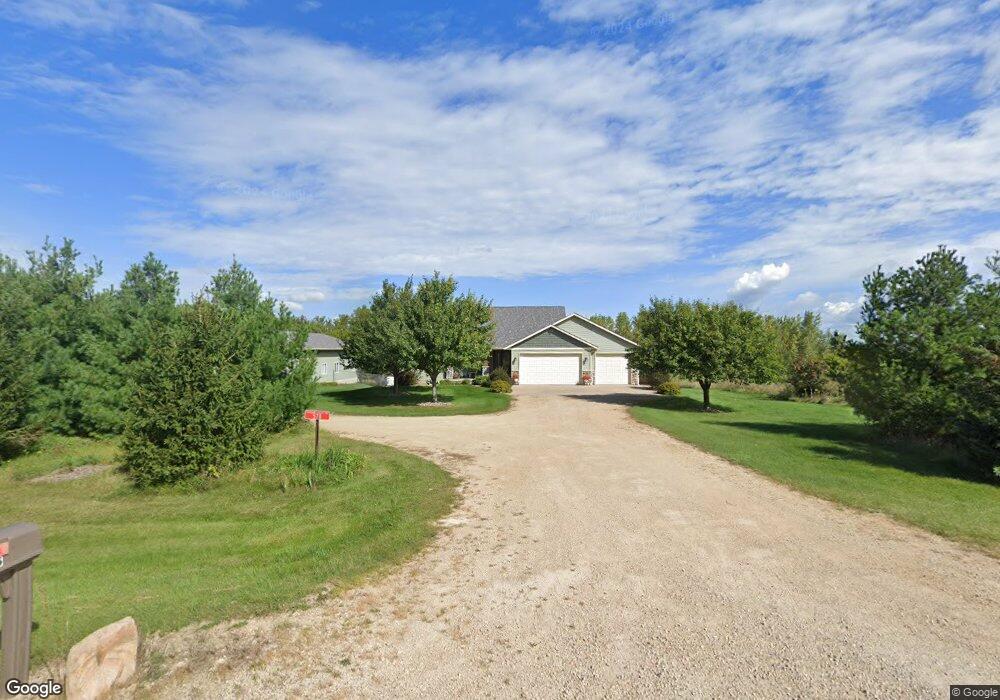
578 172nd St Hammond, WI 54015
Estimated Value: $589,000
4
Beds
3
Baths
3,246
Sq Ft
$181/Sq Ft
Est. Value
About This Home
This home is located at 578 172nd St, Hammond, WI 54015 and is currently priced at $589,000, approximately $181 per square foot. 578 172nd St is a home located in St. Croix County with nearby schools including Saint Croix Central Elementary School, Saint Croix Central Middle School, and St. Croix Central High School.
Ownership History
Date
Name
Owned For
Owner Type
Purchase Details
Closed on
Dec 18, 2020
Sold by
Shields Michael and Shields Lisa
Bought by
Graul Daniel Adam and Graul Catherine Joy
Current Estimated Value
Home Financials for this Owner
Home Financials are based on the most recent Mortgage that was taken out on this home.
Original Mortgage
$315,000
Outstanding Balance
$280,944
Interest Rate
2.8%
Mortgage Type
New Conventional
Purchase Details
Closed on
May 5, 2008
Sold by
Jim Henry Inc
Bought by
Shields Michael and Shields Lisa
Home Financials for this Owner
Home Financials are based on the most recent Mortgage that was taken out on this home.
Original Mortgage
$36,750
Interest Rate
6.12%
Mortgage Type
Purchase Money Mortgage
Create a Home Valuation Report for This Property
The Home Valuation Report is an in-depth analysis detailing your home's value as well as a comparison with similar homes in the area
Home Values in the Area
Average Home Value in this Area
Purchase History
| Date | Buyer | Sale Price | Title Company |
|---|---|---|---|
| Graul Daniel Adam | $420,000 | Partners Title | |
| Shields Michael | $245,000 | None Available | |
| Jim Henry Inc | -- | None Available |
Source: Public Records
Mortgage History
| Date | Status | Borrower | Loan Amount |
|---|---|---|---|
| Open | Graul Daniel Adam | $315,000 | |
| Previous Owner | Jim Henry Inc | $36,750 | |
| Previous Owner | Shields Michael | $183,750 |
Source: Public Records
Tax History Compared to Growth
Tax History
| Year | Tax Paid | Tax Assessment Tax Assessment Total Assessment is a certain percentage of the fair market value that is determined by local assessors to be the total taxable value of land and additions on the property. | Land | Improvement |
|---|---|---|---|---|
| 2024 | $75 | $583,900 | $94,000 | $489,900 |
| 2023 | $6,210 | $583,900 | $94,000 | $489,900 |
| 2022 | $4,906 | $313,100 | $26,700 | $286,400 |
| 2021 | $5,084 | $267,800 | $26,700 | $241,100 |
| 2020 | $4,930 | $267,800 | $26,700 | $241,100 |
| 2019 | $3,522 | $267,800 | $26,700 | $241,100 |
| 2018 | $4,612 | $267,800 | $26,700 | $241,100 |
| 2017 | $4,377 | $267,800 | $26,700 | $241,100 |
| 2016 | $4,377 | $267,800 | $26,700 | $241,100 |
| 2015 | $3,864 | $249,300 | $52,700 | $196,600 |
| 2014 | $3,907 | $249,300 | $52,700 | $196,600 |
| 2013 | $3,771 | $249,300 | $52,700 | $196,600 |
Source: Public Records
Map
Nearby Homes
- 1706 57th Ave
- Lot 3 60th Ave
- Lot 2 60th Ave
- 720 165th St
- 745 165th St
- 747 165th St
- 1637 72nd Ave
- 1632 72nd Ave
- 729 163rd St
- 727 163rd St
- 714 160th St
- 747 165th Ave
- 1643 75th Ave
- 1639 75th Ave
- 1613 75th Ave
- 1637 75th Ave
- 1635 75th Ave
- 1685 178th St Dalton Farm Road Lot 25
- 415 Johnson Pkwy
- 1110 Eulaine Cir