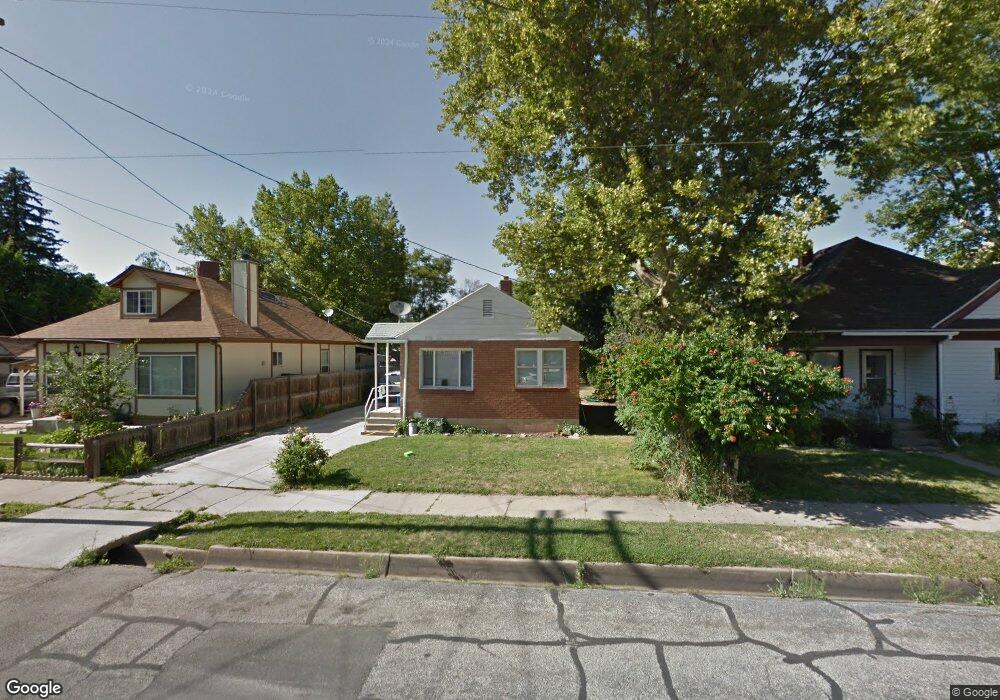
578 4th St Ogden, UT 84404
Hillcrest-Bonneville NeighborhoodEstimated Value: $270,000 - $338,000
3
Beds
1
Bath
1,280
Sq Ft
$237/Sq Ft
Est. Value
About This Home
This home is located at 578 4th St, Ogden, UT 84404 and is currently estimated at $303,502, approximately $237 per square foot. 578 4th St is a home located in Weber County with nearby schools including Bonneville School, Highland Junior High School, and Ben Lomond High School.
Ownership History
Date
Name
Owned For
Owner Type
Purchase Details
Closed on
Sep 23, 2010
Sold by
Lloyd Kurt
Bought by
K N C Properties Llc
Current Estimated Value
Purchase Details
Closed on
Sep 21, 2010
Sold by
Comer Nancy Maralene Lahey
Bought by
Lloyd Kurt
Purchase Details
Closed on
Jul 13, 2009
Sold by
Lahey Glenn Herbert and Comer Nancy Maralane Lahey
Bought by
Comer Nancy Maralane Lahey
Purchase Details
Closed on
Sep 30, 2008
Sold by
Lahey Cho Landon
Bought by
Comer Nancy Maralane Lahey
Purchase Details
Closed on
Aug 3, 2004
Sold by
Lahey Glenn Herbert
Bought by
Lahey Glenn Herbert and Lahey Cho Landon
Purchase Details
Closed on
Jan 6, 2003
Sold by
Cutrubus Motors Trust & Profit Sharing
Bought by
The Glenn Herbert Lahey Family Trust and Lahey Glenn Herbert
Purchase Details
Closed on
Jan 9, 1996
Sold by
Glenn Herbert Lahey Family Trust and Lahey Glenn Herbert
Bought by
Cutrubus Motors Trust & Profit Sharing
Create a Home Valuation Report for This Property
The Home Valuation Report is an in-depth analysis detailing your home's value as well as a comparison with similar homes in the area
Home Values in the Area
Average Home Value in this Area
Purchase History
| Date | Buyer | Sale Price | Title Company |
|---|---|---|---|
| K N C Properties Llc | -- | Accommodation | |
| Lloyd Kurt | -- | First American Layton | |
| Comer Nancy Maralane Lahey | -- | None Available | |
| Comer Nancy Maralane Lahey | -- | None Available | |
| Lahey Glenn Herbert | -- | None Available | |
| The Glenn Herbert Lahey Family Trust | -- | -- | |
| Cutrubus Motors Trust & Profit Sharing | -- | -- |
Source: Public Records
Tax History
| Year | Tax Paid | Tax Assessment Tax Assessment Total Assessment is a certain percentage of the fair market value that is determined by local assessors to be the total taxable value of land and additions on the property. | Land | Improvement |
|---|---|---|---|---|
| 2025 | $1,713 | $251,127 | $104,185 | $146,942 |
| 2024 | $1,751 | $252,000 | $104,185 | $147,815 |
| 2023 | $1,512 | $219,000 | $96,409 | $122,591 |
| 2022 | $1,459 | $212,000 | $76,997 | $135,003 |
| 2021 | $1,169 | $155,000 | $46,822 | $108,178 |
| 2020 | $971 | $119,000 | $37,542 | $81,458 |
| 2019 | $878 | $101,000 | $27,458 | $73,542 |
| 2018 | $700 | $80,000 | $22,715 | $57,285 |
| 2017 | $646 | $69,000 | $22,715 | $46,285 |
| 2016 | $554 | $31,941 | $11,656 | $20,285 |
| 2015 | $532 | $29,939 | $11,656 | $18,283 |
| 2014 | $398 | $22,022 | $10,215 | $11,807 |
Source: Public Records
Map
Nearby Homes
- 525 3rd St
- 758 3rd St
- 756 3rd St
- 541 Cook St
- 598 Plum Creek Ln
- 615 S Plum Creek Ln E
- 740 N 175 E
- 1636 Washington Blvd
- 426 Grant Ave
- 626 Chester St
- 415 Jackson Ave
- 545 Chester St
- 708 9th St
- 1005 Douglas St
- 718 9th St
- 200 N Harrisville Rd Unit 21
- 580 Marco Ln
- 317 E 750 S Unit 12
- 1029 Douglas St
- 600 Lincoln Ave Unit REAR
Your Personal Tour Guide
Ask me questions while you tour the home.