Estimated Value: $388,961 - $536,000
4
Beds
4
Baths
2,822
Sq Ft
$157/Sq Ft
Est. Value
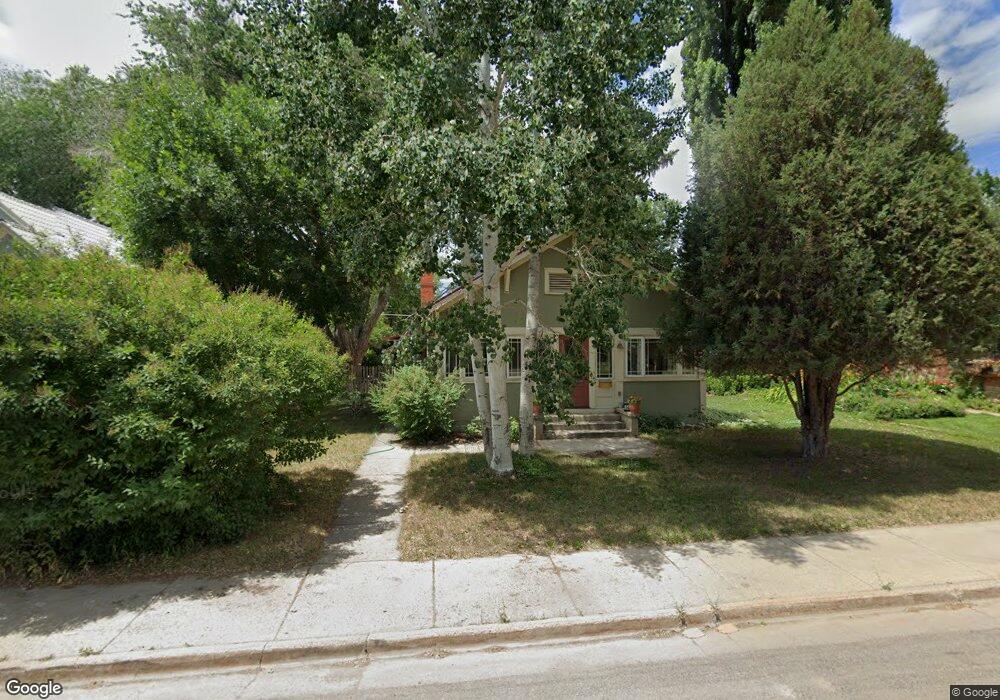
About This Home
This home is located at 578 Barclay St, Craig, CO 81625 and is currently estimated at $443,740, approximately $157 per square foot. 578 Barclay St is a home located in Moffat County with nearby schools including Sunset Elementary School, Moffat County High School, and Calvary Baptist School.
Ownership History
Date
Name
Owned For
Owner Type
Purchase Details
Closed on
Sep 6, 2024
Sold by
Prairie Rose Ultra Trust
Bought by
Smith Rancho Land & Livestock Llc
Current Estimated Value
Purchase Details
Closed on
Aug 28, 2023
Sold by
Wadge Mary Ann
Bought by
Wadge James Bryan and Wadge Alan John
Purchase Details
Closed on
Nov 17, 2021
Sold by
Bradford M Smith Revocable Trust
Bought by
Bradford M Smith Revocable Trust
Purchase Details
Closed on
Jan 17, 2021
Sold by
Bradford M Smith Revocable Trust
Bought by
Bradford M Smith Revocable Trust
Create a Home Valuation Report for This Property
The Home Valuation Report is an in-depth analysis detailing your home's value as well as a comparison with similar homes in the area
Purchase History
| Date | Buyer | Sale Price | Title Company |
|---|---|---|---|
| Smith Rancho Land & Livestock Llc | $191,997 | None Listed On Document | |
| Wadge James Bryan | -- | None Listed On Document | |
| Bradford M Smith Revocable Trust | -- | None Listed On Document | |
| Bradford M Smith Revocable Trust | -- | None Available |
Source: Public Records
Tax History
| Year | Tax Paid | Tax Assessment Tax Assessment Total Assessment is a certain percentage of the fair market value that is determined by local assessors to be the total taxable value of land and additions on the property. | Land | Improvement |
|---|---|---|---|---|
| 2025 | $2,386 | $25,980 | $0 | $0 |
| 2024 | $2,386 | $20,560 | $0 | $0 |
| 2023 | $1,783 | $20,560 | $1,010 | $19,550 |
| 2022 | $1,598 | $18,960 | $1,240 | $17,720 |
| 2021 | $1,614 | $19,500 | $1,270 | $18,230 |
| 2020 | $1,391 | $17,020 | $1,270 | $15,750 |
| 2019 | $1,378 | $17,020 | $1,270 | $15,750 |
| 2018 | $1,175 | $14,440 | $1,280 | $13,160 |
| 2017 | $1,212 | $14,440 | $1,280 | $13,160 |
| 2016 | $1,337 | $16,480 | $1,420 | $15,060 |
| 2015 | $1,406 | $16,480 | $1,420 | $15,060 |
| 2013 | $1,406 | $17,080 | $1,420 | $15,660 |
Source: Public Records
Map
Nearby Homes
Your Personal Tour Guide
Ask me questions while you tour the home.