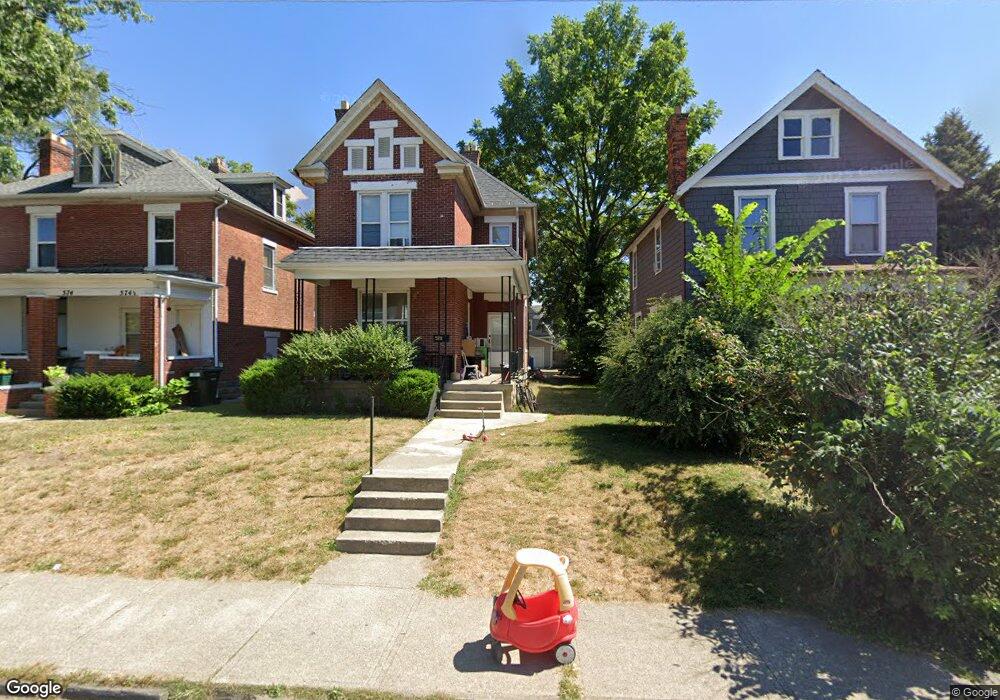
578 Carpenter St Columbus, OH 43205
Livingston Park NeighborhoodEstimated Value: $196,000 - $274,441
3
Beds
1
Bath
1,484
Sq Ft
$170/Sq Ft
Est. Value
About This Home
This home is located at 578 Carpenter St, Columbus, OH 43205 and is currently estimated at $252,360, approximately $170 per square foot. 578 Carpenter St is a home located in Franklin County with nearby schools including Livingston Elementary School, South High School, and South Columbus Preparatory Academy.
Ownership History
Date
Name
Owned For
Owner Type
Purchase Details
Closed on
Jul 19, 2005
Sold by
Hughes A and E Financial Trust
Bought by
The Childrens Hospital and Childrens Hospital Inc
Current Estimated Value
Purchase Details
Closed on
May 11, 2005
Sold by
Estate Of Gladys T Poe
Bought by
Taylor Ethel and Poe Kenneth Wayne
Home Financials for this Owner
Home Financials are based on the most recent Mortgage that was taken out on this home.
Original Mortgage
$18,000
Interest Rate
5.91%
Mortgage Type
Purchase Money Mortgage
Purchase Details
Closed on
May 6, 2005
Sold by
Taylor Ethel and Poe Kenneth Wayne
Bought by
Hughes A and E Financial Trust
Home Financials for this Owner
Home Financials are based on the most recent Mortgage that was taken out on this home.
Original Mortgage
$18,000
Interest Rate
5.91%
Mortgage Type
Purchase Money Mortgage
Purchase Details
Closed on
Jun 3, 1974
Bought by
Poe Gladys T
Create a Home Valuation Report for This Property
The Home Valuation Report is an in-depth analysis detailing your home's value as well as a comparison with similar homes in the area
Home Values in the Area
Average Home Value in this Area
Purchase History
| Date | Buyer | Sale Price | Title Company |
|---|---|---|---|
| The Childrens Hospital | $34,000 | -- | |
| Taylor Ethel | -- | -- | |
| Hughes A | $15,000 | -- | |
| Poe Gladys T | -- | -- |
Source: Public Records
Mortgage History
| Date | Status | Borrower | Loan Amount |
|---|---|---|---|
| Previous Owner | Taylor Ethel | $18,000 | |
| Previous Owner | Hughes A | $18,000 |
Source: Public Records
Tax History
| Year | Tax Paid | Tax Assessment Tax Assessment Total Assessment is a certain percentage of the fair market value that is determined by local assessors to be the total taxable value of land and additions on the property. | Land | Improvement |
|---|---|---|---|---|
| 2025 | $4,665 | $97,300 | $29,190 | $68,110 |
| 2024 | $4,665 | $97,300 | $29,190 | $68,110 |
| 2023 | $4,403 | $97,300 | $29,190 | $68,110 |
| 2022 | $1,473 | $27,720 | $1,470 | $26,250 |
| 2021 | $1,606 | $27,720 | $1,470 | $26,250 |
| 2020 | $1,478 | $27,720 | $1,470 | $26,250 |
| 2019 | $1,467 | $23,600 | $1,230 | $22,370 |
| 2018 | $1,558 | $23,600 | $1,230 | $22,370 |
| 2017 | $1,467 | $23,600 | $1,230 | $22,370 |
| 2016 | $1,813 | $26,680 | $9,770 | $16,910 |
| 2015 | $1,650 | $26,680 | $9,770 | $16,910 |
| 2014 | $786 | $12,670 | $8,190 | $4,480 |
| 2013 | $481 | $13,335 | $8,610 | $4,725 |
Source: Public Records
Map
Nearby Homes
- 662 S 22nd St Unit 664
- 0 Carpenter St
- 605 S Ohio Ave
- 711 S 22nd St
- 904 E Livingston Ave
- 674 S Ohio Ave
- 903 E Livingston Ave
- 1036 Newton St Unit 38
- 631-633 S Champion Ave
- 452 Gilbert St
- 461 S 22nd St
- 741 Heyl Ave
- 891 E Mound St
- 700 S Champion Ave Unit 702
- 517 S Champion Ave
- 513 S Champion Ave
- 730 S Champion Ave
- 795 S Ohio Ave
- 800 Carpenter St
- 647 Oakwood Ave
- 574 Carpenter St Unit 574
- 582 Carpenter St
- 590 Carpenter St
- 558 Carpenter St
- 558 Carpenter St
- 558 Carpenter St
- 558 Carpenter St
- 558 Carpenter St
- 558 Carpenter St
- 558 Carpenter St
- 570 Carpenter St
- 538 Carpenter St
- 538 Carpenter St
- 538 Carpenter St
- 538 Carpenter St
- 538 Carpenter St
- 538 Carpenter St
- 560 Carpenter St
- 585 Gilbert St
- 579-581 Gilbert St
Your Personal Tour Guide
Ask me questions while you tour the home.