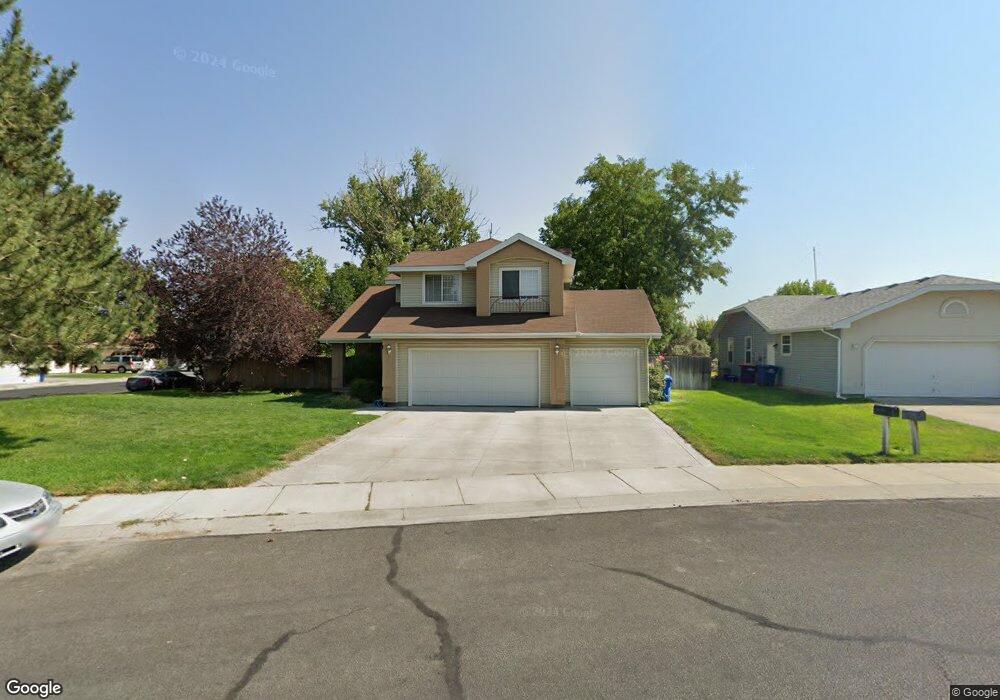
578 Cypress Way Twin Falls, ID 83301
Estimated Value: $370,000 - $430,000
3
Beds
3
Baths
1,733
Sq Ft
$233/Sq Ft
Est. Value
About This Home
This home is located at 578 Cypress Way, Twin Falls, ID 83301 and is currently estimated at $403,820, approximately $233 per square foot. 578 Cypress Way is a home located in Twin Falls County with nearby schools including Morningside Elementary School, Vera C. O'Leary Middle School, and Twin Falls Senior High School.
Ownership History
Date
Name
Owned For
Owner Type
Purchase Details
Closed on
May 22, 2008
Sold by
Steinbach Christopher and Prawdzik Steinbach Nancy A
Bought by
Hancock Levi N and Hancock Kirsten M
Current Estimated Value
Purchase Details
Closed on
Feb 25, 2005
Sold by
Louton Paul L and Louton Kathy I
Bought by
Steinbach Christopher and Prawdzik Steinbach Nancy A
Home Financials for this Owner
Home Financials are based on the most recent Mortgage that was taken out on this home.
Original Mortgage
$139,920
Interest Rate
5.5%
Mortgage Type
Adjustable Rate Mortgage/ARM
Create a Home Valuation Report for This Property
The Home Valuation Report is an in-depth analysis detailing your home's value as well as a comparison with similar homes in the area
Home Values in the Area
Average Home Value in this Area
Purchase History
| Date | Buyer | Sale Price | Title Company |
|---|---|---|---|
| Hancock Levi N | -- | Alliance Title | |
| Steinbach Christopher | -- | -- |
Source: Public Records
Mortgage History
| Date | Status | Borrower | Loan Amount |
|---|---|---|---|
| Previous Owner | Steinbach Christopher | $139,920 |
Source: Public Records
Tax History Compared to Growth
Tax History
| Year | Tax Paid | Tax Assessment Tax Assessment Total Assessment is a certain percentage of the fair market value that is determined by local assessors to be the total taxable value of land and additions on the property. | Land | Improvement |
|---|---|---|---|---|
| 2025 | $3,624 | $337,529 | $85,069 | $252,460 |
| 2024 | $3,660 | $340,859 | $85,069 | $255,790 |
| 2023 | $3,738 | $357,469 | $85,069 | $272,400 |
| 2022 | $3,736 | $326,247 | $58,478 | $267,769 |
| 2021 | $3,972 | $263,833 | $63,251 | $200,582 |
| 2020 | $3,225 | $211,389 | $50,616 | $160,773 |
| 2019 | $3,683 | $206,146 | $50,616 | $155,530 |
| 2018 | $3,636 | $194,156 | $34,753 | $159,403 |
| 2017 | $3,356 | $179,035 | $34,753 | $144,282 |
| 2016 | $3,230 | $161,165 | $0 | $0 |
| 2015 | $3,143 | $161,165 | $34,753 | $126,412 |
| 2012 | -- | $147,085 | $0 | $0 |
Source: Public Records
Map
Nearby Homes
- 738 Aspenwood Ln
- 2522 Elizabeth Blvd
- 2545 Eastgate Dr
- 772 Apache Way
- 2556 4th Ave E
- 806 Hiawatha Way
- 2630 Paintbrush Dr
- 968 Trotter Dr
- 2658 Addison Ave E
- 0 Atlas Ave
- Lot 22 Atlas Ave
- 917 Del Mar Cir
- 2893 Deaun Ave
- 230 Buckingham Dr
- 374 Joellen Dr
- 524 Meadowlark Way
- 1964 Alta Dr
- 265 Cedar Park Cir
- 424 Meadowlark Way
- 292 Joellen Dr
- 560 Cypress Way
- 2500 Elizabeth Blvd
- 546 Cypress Way
- 2487 & 248 Elizabeth Blvd
- 2487 & 2483 Elizabeth Blvd
- 2487 Elizabeth Blvd
- 575 Cypress Way
- 614 Cypress Way
- 559 Cypress Way
- 545 Cypress Way
- 632 Cypress Way
- 532 Cypress Way
- 613 Cypress Way
- 625 Cypress Way
- 2440 Elizabeth Blvd
- 617 Mae Dr
- 520 Cypress Way
- 533 Cypress Way
- 644 Cypress Way
- 2506 Elizabeth Blvd