
578 E Broadway Unit 2 Boston, MA 02127
South Boston Neighborhood
1
Bed
1
Bath
672
Sq Ft
871
Sq Ft Lot
About This Home
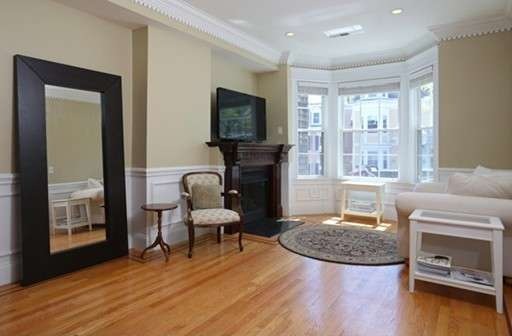
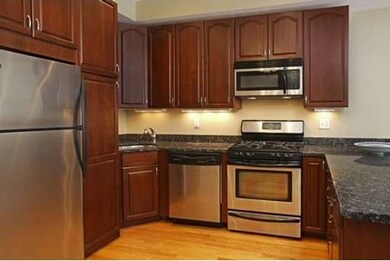
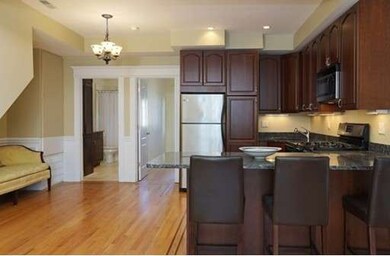
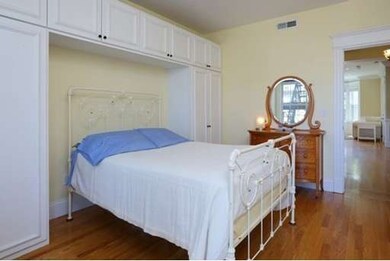
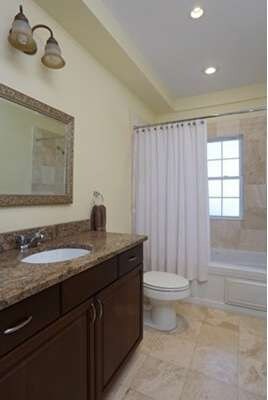
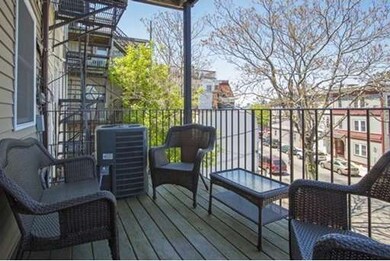
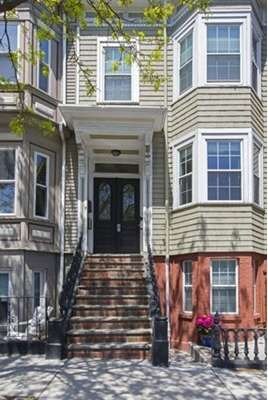
As of May 2020Lovely, spacious one-bedroom condo ideally situated on E. Broadway at H Street in the heart of South Boston's desirable East Side! Renovated just two years ago. Close to all that South Boston has to offer - restaurants, supermarkets, vibrant nightlife. Joe Moakley Park, City Point, Castle Island - all at your fingertips. Hop the bus right out front and head to the beach or into Downtown. Or, a pleasant stroll to the beach; it's only a few blocks! Abundant sunlight streams through your windows. Detailed crown molding; warm winter nights by your cozy fireplace; generously-sized bedroom; gleaming hardwood floors throughout. Kitchen features custom cabinets, granite counters, breakfast bar and stainless steel appliances. Open floor plan for easy entertaining. Your own private deck. A delightful city home. Come, make it yours!
Last Agent to Sell the Property
Keller Williams Realty Boston-Metro | Back Bay Listed on: 05/26/2015
Property Details
Home Type
Condominium
Est. Annual Taxes
$6,000
Year Built
1890
Lot Details
0
Listing Details
- Unit Level: 2
- Unit Placement: Upper
- Other Agent: 1.00
- Special Features: None
- Property Sub Type: Condos
- Year Built: 1890
Interior Features
- Fireplaces: 1
- Has Basement: No
- Fireplaces: 1
- Number of Rooms: 3
- Amenities: Public Transportation, Shopping, Park, Laundromat, Highway Access, House of Worship, Public School, T-Station
Garage/Parking
- Parking: On Street Permit
- Parking Spaces: 0
Utilities
- Cooling: Central Air
- Heating: Forced Air
Condo/Co-op/Association
- Association Fee Includes: Water, Sewer, Master Insurance
- Association Pool: No
- Management: Owner Association
- Pets Allowed: Yes
- No Units: 3
- Unit Building: 2
Lot Info
- Assessor Parcel Number: W:06 P:03191 S:004
Ownership History
Date
Name
Owned For
Owner Type
Purchase Details
Listed on
Mar 18, 2020
Closed on
Apr 29, 2020
Sold by
Smolik Taylor and Smolik Shaina
Bought by
Pedersen Sarah
Seller's Agent
Marc Croteau
Coldwell Banker Realty - Boston
Buyer's Agent
John McDonough
Block Realty
List Price
$539,000
Sold Price
$535,000
Premium/Discount to List
-$4,000
-0.74%
Current Estimated Value
Home Financials for this Owner
Home Financials are based on the most recent Mortgage that was taken out on this home.
Estimated Appreciation
$58,670
Avg. Annual Appreciation
2.01%
Purchase Details
Listed on
May 26, 2015
Closed on
Jul 30, 2015
Sold by
Ring Alison B
Bought by
Smolik Taylor
Seller's Agent
Fine Homes Group
Keller Williams Realty Boston-Metro | Back Bay
Buyer's Agent
Marc Croteau
Coldwell Banker Realty - Boston
List Price
$419,000
Sold Price
$426,000
Premium/Discount to List
$7,000
1.67%
Home Financials for this Owner
Home Financials are based on the most recent Mortgage that was taken out on this home.
Avg. Annual Appreciation
4.87%
Original Mortgage
$176,000
Interest Rate
3.97%
Mortgage Type
New Conventional
Purchase Details
Listed on
Jan 30, 2013
Closed on
Apr 30, 2013
Sold by
Ring Richard E and Brennan-Ring Ellen
Bought by
Ring Alison B
Seller's Agent
Robin Hanley
Robin Hanley
Buyer's Agent
Fine Homes Group
Keller Williams Realty Boston-Metro | Back Bay
List Price
$349,000
Sold Price
$350,000
Premium/Discount to List
$1,000
0.29%
Home Financials for this Owner
Home Financials are based on the most recent Mortgage that was taken out on this home.
Avg. Annual Appreciation
8.72%
Original Mortgage
$250,000
Interest Rate
3.64%
Mortgage Type
New Conventional
Purchase Details
Listed on
Jan 30, 2013
Closed on
Mar 22, 2013
Sold by
Murtagh Patrick
Bought by
Ring Richard E and Brennan-Ring Ellen
Seller's Agent
Robin Hanley
Robin Hanley
Buyer's Agent
Fine Homes Group
Keller Williams Realty Boston-Metro | Back Bay
List Price
$349,000
Sold Price
$350,000
Premium/Discount to List
$1,000
0.29%
Home Financials for this Owner
Home Financials are based on the most recent Mortgage that was taken out on this home.
Original Mortgage
$250,000
Interest Rate
3.64%
Mortgage Type
New Conventional
Similar Homes in the area
Create a Home Valuation Report for This Property
The Home Valuation Report is an in-depth analysis detailing your home's value as well as a comparison with similar homes in the area
Home Values in the Area
Average Home Value in this Area
Purchase History
| Date | Type | Sale Price | Title Company |
|---|---|---|---|
| Not Resolvable | $535,000 | None Available | |
| Not Resolvable | $426,000 | -- | |
| Quit Claim Deed | $350,000 | -- | |
| Quit Claim Deed | $350,000 | -- | |
| Deed | $350,000 | -- |
Source: Public Records
Mortgage History
| Date | Status | Loan Amount | Loan Type |
|---|---|---|---|
| Previous Owner | $176,000 | New Conventional | |
| Previous Owner | $250,000 | New Conventional | |
| Previous Owner | $244,000 | No Value Available |
Source: Public Records
Property History
| Date | Event | Price | Change | Sq Ft Price |
|---|---|---|---|---|
| 05/11/2020 05/11/20 | Sold | $535,000 | -0.7% | $796 / Sq Ft |
| 03/24/2020 03/24/20 | Pending | -- | -- | -- |
| 03/18/2020 03/18/20 | For Sale | $539,000 | +26.5% | $802 / Sq Ft |
| 07/29/2015 07/29/15 | Sold | $426,000 | 0.0% | $634 / Sq Ft |
| 06/14/2015 06/14/15 | Pending | -- | -- | -- |
| 05/31/2015 05/31/15 | Off Market | $426,000 | -- | -- |
| 05/29/2015 05/29/15 | For Sale | $419,000 | -1.6% | $624 / Sq Ft |
| 05/28/2015 05/28/15 | Off Market | $426,000 | -- | -- |
| 05/26/2015 05/26/15 | For Sale | $419,000 | +19.7% | $624 / Sq Ft |
| 03/22/2013 03/22/13 | Sold | $350,000 | +0.3% | $521 / Sq Ft |
| 03/12/2013 03/12/13 | Pending | -- | -- | -- |
| 01/30/2013 01/30/13 | For Sale | $349,000 | -- | $519 / Sq Ft |
Source: MLS Property Information Network (MLS PIN)
Tax History Compared to Growth
Tax History
| Year | Tax Paid | Tax Assessment Tax Assessment Total Assessment is a certain percentage of the fair market value that is determined by local assessors to be the total taxable value of land and additions on the property. | Land | Improvement |
|---|---|---|---|---|
| 2025 | $6,000 | $518,100 | $0 | $518,100 |
| 2024 | $5,628 | $516,300 | $0 | $516,300 |
| 2023 | $5,432 | $505,800 | $0 | $505,800 |
| 2022 | $5,291 | $486,300 | $0 | $486,300 |
| 2021 | $5,086 | $476,700 | $0 | $476,700 |
| 2020 | $4,901 | $464,100 | $0 | $464,100 |
| 2019 | $4,573 | $433,900 | $0 | $433,900 |
| 2018 | $4,329 | $413,100 | $0 | $413,100 |
| 2017 | $4,090 | $386,200 | $0 | $386,200 |
| 2016 | $4,007 | $364,300 | $0 | $364,300 |
| 2015 | $3,843 | $317,300 | $0 | $317,300 |
| 2014 | $3,563 | $283,200 | $0 | $283,200 |
Source: Public Records
Agents Affiliated with this Home
-
Seller's Agent in 2020
Marc Croteau
Coldwell Banker Realty - Boston
(617) 429-9055
10 in this area
39 Total Sales
-
J
Buyer's Agent in 2020
John McDonough
Block Realty
(617) 763-0335
1 in this area
32 Total Sales
-
F
Seller's Agent in 2015
Fine Homes Group
Keller Williams Realty Boston-Metro | Back Bay
(603) 556-7110
1 in this area
87 Total Sales
-
R
Seller's Agent in 2013
Robin Hanley
Robin Hanley
(617) 905-1011
1 in this area
6 Total Sales
Map
Source: MLS Property Information Network (MLS PIN)
MLS Number: 71843561
APN: SBOS-000000-000006-003191-000004
Disclaimer: Certain information contained herein is derived from information provided by parties other than Homes.com. All information provided is deemed reliable, but is not guaranteed to be accurate and should be independently verified.
![]() The property listing data and information, or the Images, set forth herein were provided to MLS Property Information Network, Inc. from third party sources, including sellers, lessors and public records, and were compiled by MLS Property Information Network, Inc. The property listing data and information, and the Images, are for the personal, non-commercial use of consumers having a good faith interest in purchasing or leasing listed properties of the type displayed to them and may not be used for any purpose other than to identify prospective properties which such consumers may have a good faith interest in purchasing or leasing. MLS Property Information Network, Inc. and its subscribers disclaim any and all representations and warranties as to the accuracy of the property listing data and information, or as to the accuracy of any of the Images, set forth herein.
The property listing data and information, or the Images, set forth herein were provided to MLS Property Information Network, Inc. from third party sources, including sellers, lessors and public records, and were compiled by MLS Property Information Network, Inc. The property listing data and information, and the Images, are for the personal, non-commercial use of consumers having a good faith interest in purchasing or leasing listed properties of the type displayed to them and may not be used for any purpose other than to identify prospective properties which such consumers may have a good faith interest in purchasing or leasing. MLS Property Information Network, Inc. and its subscribers disclaim any and all representations and warranties as to the accuracy of the property listing data and information, or as to the accuracy of any of the Images, set forth herein.
Nearby Homes
- 565 E Broadway
- 561 E Broadway Unit 561
- 559 E Broadway Unit 559
- 428-432 E 3rd St
- 538 E Broadway
- 606 E 4th St Unit 203
- 531-533 E 2nd St Unit 202
- 54 I St
- 616 E 4th St Unit 404
- 616 E 4th St Unit 204
- 530 E Broadway Unit A
- 9-11 Linley Terrace Unit 2
- 26 Emerson St
- 515 E 2nd St Unit 204
- 515 E 2nd St Unit 206
- 16 Emerson St Unit 1
- 14 I St Unit 7
- 12 I St Unit 1
- 123 H St
- 503 E 1st St Unit 8