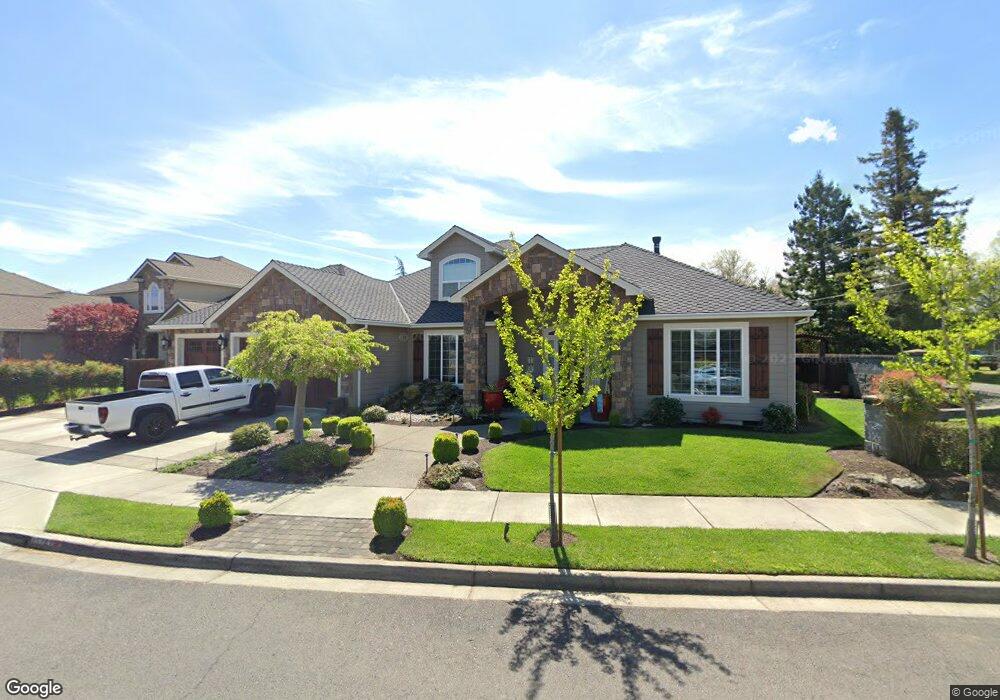
578 Grey Hawk Way Central Point, OR 97502
Estimated Value: $572,000 - $741,000
3
Beds
3
Baths
2,701
Sq Ft
$239/Sq Ft
Est. Value
About This Home
This home is located at 578 Grey Hawk Way, Central Point, OR 97502 and is currently estimated at $645,670, approximately $239 per square foot. 578 Grey Hawk Way is a home located in Jackson County with nearby schools including Richardson Elementary School, Scenic Middle School, and Crater High School.
Ownership History
Date
Name
Owned For
Owner Type
Purchase Details
Closed on
Jan 15, 2025
Sold by
Petersen Michael A and Petersen Stacy A
Bought by
Petersen Living Trust and Petersen
Current Estimated Value
Purchase Details
Closed on
Dec 1, 2009
Sold by
Harkey Homes & Design Inc
Bought by
Petersen Michael A and Petersen Stacy A
Home Financials for this Owner
Home Financials are based on the most recent Mortgage that was taken out on this home.
Original Mortgage
$175,000
Interest Rate
4.99%
Mortgage Type
New Conventional
Purchase Details
Closed on
Jul 20, 2004
Sold by
Duncan Development Llc
Bought by
Harkey Homes & Design Inc
Home Financials for this Owner
Home Financials are based on the most recent Mortgage that was taken out on this home.
Original Mortgage
$210,000
Interest Rate
6.24%
Mortgage Type
Credit Line Revolving
Create a Home Valuation Report for This Property
The Home Valuation Report is an in-depth analysis detailing your home's value as well as a comparison with similar homes in the area
Home Values in the Area
Average Home Value in this Area
Purchase History
| Date | Buyer | Sale Price | Title Company |
|---|---|---|---|
| Petersen Living Trust | -- | None Listed On Document | |
| Petersen Michael A | $80,000 | First American | |
| Harkey Homes & Design Inc | $280,000 | Amerititle |
Source: Public Records
Mortgage History
| Date | Status | Borrower | Loan Amount |
|---|---|---|---|
| Previous Owner | Petersen Michael A | $175,000 | |
| Previous Owner | Harkey Homes & Design Inc | $210,000 |
Source: Public Records
Tax History Compared to Growth
Tax History
| Year | Tax Paid | Tax Assessment Tax Assessment Total Assessment is a certain percentage of the fair market value that is determined by local assessors to be the total taxable value of land and additions on the property. | Land | Improvement |
|---|---|---|---|---|
| 2025 | $6,240 | $375,320 | $124,920 | $250,400 |
| 2024 | $6,240 | $364,390 | $121,280 | $243,110 |
| 2023 | $6,039 | $353,780 | $117,750 | $236,030 |
| 2022 | $5,898 | $353,780 | $117,750 | $236,030 |
| 2021 | $5,730 | $343,480 | $114,310 | $229,170 |
| 2020 | $5,563 | $333,480 | $110,980 | $222,500 |
| 2019 | $5,425 | $314,340 | $104,610 | $209,730 |
| 2018 | $5,260 | $305,190 | $101,570 | $203,620 |
| 2017 | $5,128 | $305,190 | $101,570 | $203,620 |
| 2016 | $4,978 | $287,680 | $95,740 | $191,940 |
| 2015 | $4,770 | $287,680 | $95,740 | $191,940 |
| 2014 | $4,648 | $271,180 | $90,240 | $180,940 |
Source: Public Records
Map
Nearby Homes
- 570 Bachand Cir
- 465 Creekside Cir
- 487 Creekside Cir
- 659 Jackson Creek Dr
- 25 Donna Way
- 3642 Oak Pine Way
- 21 Hickory Ln
- 429 Mayberry Ln
- 420 Mayberry Ln
- 3506 New Ray Rd
- 3220 Freeland Rd
- 3307 Freeland Rd
- 871 Holley Way
- 895 Holley Way
- 349 W Pine St
- 3364 Snowy Butte Ln
- 407 Silver Creek Dr
- 619 Palo Verde Way
- 448 Cheney Loop
- 626 Griffin Oaks Dr
- 574 Grey Hawk Way
- 562 Quail Ct
- 570 Grey Hawk Way
- 583 Grey Hawk Way
- 579 Grey Hawk Way
- 552 Quail Ct
- 575 Grey Hawk Way
- 564 Quail Ct
- 3361 Grant Rd
- 566 Grey Hawk Way
- 569 Grey Hawk Way
- 3343 Grant Rd
- 3395 Grant Rd
- 542 Quail Ct
- 567 Grey Hawk Way
- 760 Jean Louise Cir
- 557 Quail Ct
- 764 Jean Louise Cir
- 625 Pheasant Creek
- 625 Pheasant Creek Dr