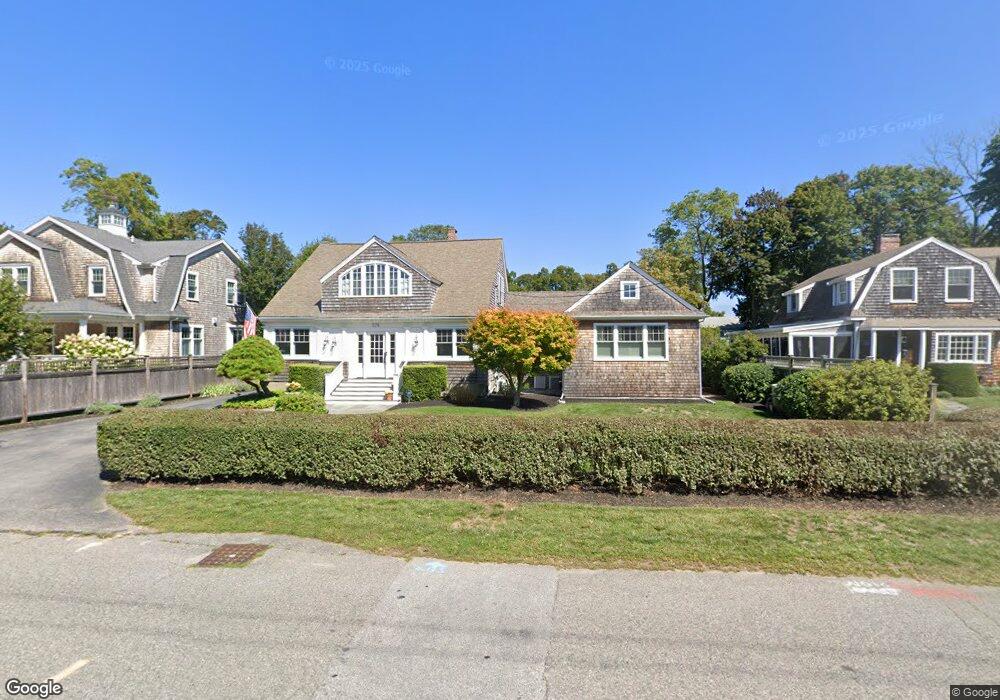
578 Hatherly Rd Scituate, MA 02066
Estimated Value: $1,190,000 - $1,854,000
5
Beds
4
Baths
2,924
Sq Ft
$564/Sq Ft
Est. Value
About This Home
This home is located at 578 Hatherly Rd, Scituate, MA 02066 and is currently estimated at $1,647,773, approximately $563 per square foot. 578 Hatherly Rd is a home located in Plymouth County with nearby schools including Wampatuck Elementary School, Lester J. Gates Middle School, and Scituate High School.
Ownership History
Date
Name
Owned For
Owner Type
Purchase Details
Closed on
Feb 10, 2021
Sold by
Ross Richard M and Ross Karen M
Bought by
Richard M Ross Ft
Current Estimated Value
Purchase Details
Closed on
Jul 31, 2003
Sold by
Desmond Muriel F
Bought by
Ross Richard M and Ross Karen M
Home Financials for this Owner
Home Financials are based on the most recent Mortgage that was taken out on this home.
Original Mortgage
$319,000
Interest Rate
5.28%
Mortgage Type
Purchase Money Mortgage
Create a Home Valuation Report for This Property
The Home Valuation Report is an in-depth analysis detailing your home's value as well as a comparison with similar homes in the area
Home Values in the Area
Average Home Value in this Area
Purchase History
| Date | Buyer | Sale Price | Title Company |
|---|---|---|---|
| Richard M Ross Ft | -- | None Available | |
| Ross Richard M | $629,000 | -- |
Source: Public Records
Mortgage History
| Date | Status | Borrower | Loan Amount |
|---|---|---|---|
| Previous Owner | Ross Richard M | $319,000 | |
| Previous Owner | Ross Richard M | $200,000 |
Source: Public Records
Tax History Compared to Growth
Tax History
| Year | Tax Paid | Tax Assessment Tax Assessment Total Assessment is a certain percentage of the fair market value that is determined by local assessors to be the total taxable value of land and additions on the property. | Land | Improvement |
|---|---|---|---|---|
| 2025 | $14,265 | $1,427,900 | $607,100 | $820,800 |
| 2024 | $14,820 | $1,430,500 | $625,500 | $805,000 |
| 2023 | $14,651 | $1,275,400 | $568,700 | $706,700 |
| 2022 | $14,651 | $1,160,900 | $567,100 | $593,800 |
| 2021 | $13,963 | $1,047,500 | $540,100 | $507,400 |
| 2020 | $11,732 | $869,000 | $519,200 | $349,800 |
| 2019 | $11,373 | $827,700 | $509,100 | $318,600 |
| 2018 | $11,210 | $803,600 | $512,800 | $290,800 |
| 2017 | $10,721 | $760,900 | $470,100 | $290,800 |
| 2016 | $9,865 | $697,700 | $416,700 | $281,000 |
| 2015 | $8,860 | $676,300 | $395,300 | $281,000 |
Source: Public Records
Map
Nearby Homes
- 27 Cherry Ln
- 10 Baileys Causeway
- 29 Country Club Cir
- 6 Tilden Ave
- 7 Border St
- 24 Wood Island Rd
- 16 3 Ring Rd
- 112 Hollett St
- 26 Mordecai Lincoln Rd
- 70 Black Horse Ln
- 68 Black Horse Ln
- 100 Howard Gleason Rd
- 104 Howard Gleason Rd
- 378 Tilden Rd
- 392 S Main St
- 817 Country Way
- 98 Black Horse Ln
- 309 S Main St
- 59 Captain Peirce Rd
- 212 S Main St