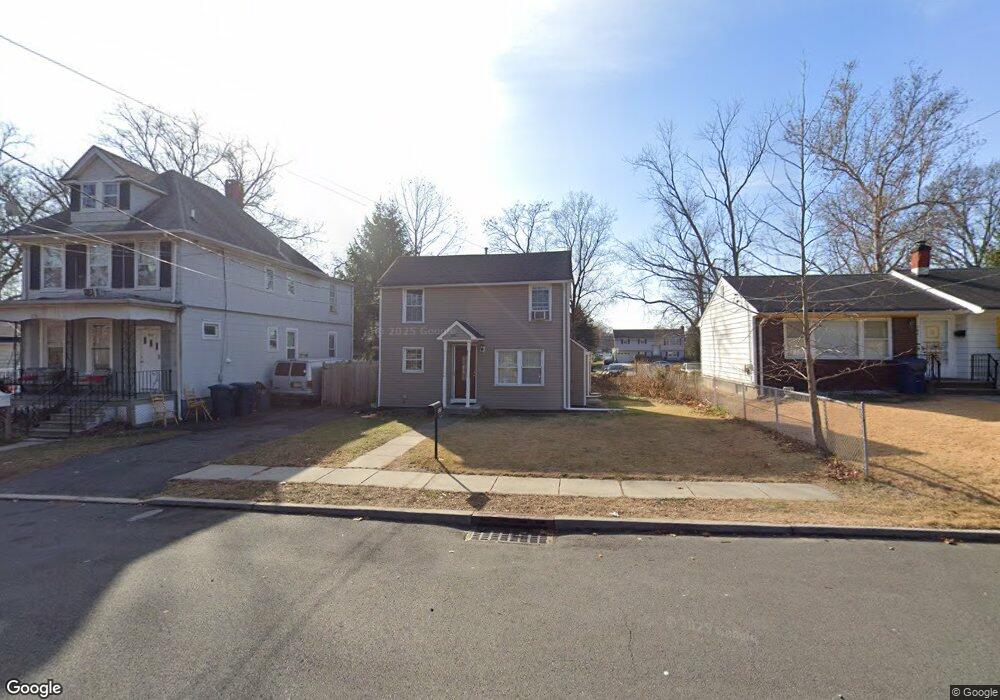
578 Nassau St North Brunswick, NJ 08902
Estimated Value: $333,000 - $392,000
2
Beds
2
Baths
970
Sq Ft
$384/Sq Ft
Est. Value
About This Home
This home is located at 578 Nassau St, North Brunswick, NJ 08902 and is currently estimated at $372,040, approximately $383 per square foot. 578 Nassau St is a home located in Middlesex County with nearby schools including Parsons Elementary School, Linwood Middle School, and North Brunswick Twp High School.
Ownership History
Date
Name
Owned For
Owner Type
Purchase Details
Closed on
Oct 18, 2023
Sold by
Henry Roy
Bought by
Jan Aziz
Current Estimated Value
Purchase Details
Closed on
Dec 18, 2018
Sold by
Mejia Eva Pelaez
Bought by
Henry Roy
Home Financials for this Owner
Home Financials are based on the most recent Mortgage that was taken out on this home.
Original Mortgage
$221,906
Interest Rate
5.37%
Mortgage Type
FHA
Purchase Details
Closed on
Feb 26, 2016
Sold by
Patel Anjanaben S
Bought by
Mejia Eva Pelaez
Purchase Details
Closed on
Nov 24, 2009
Sold by
Ashamole Sylvanus U and Ashamole Patricia
Bought by
Patel Anjanaben S
Purchase Details
Closed on
Nov 24, 1997
Sold by
Conover Diane
Bought by
Osuebi Sylvanus and Ashamole Patricia
Home Financials for this Owner
Home Financials are based on the most recent Mortgage that was taken out on this home.
Original Mortgage
$97,000
Interest Rate
7.28%
Mortgage Type
FHA
Create a Home Valuation Report for This Property
The Home Valuation Report is an in-depth analysis detailing your home's value as well as a comparison with similar homes in the area
Home Values in the Area
Average Home Value in this Area
Purchase History
| Date | Buyer | Sale Price | Title Company |
|---|---|---|---|
| Jan Aziz | $270,000 | Evident Title Agency | |
| Aziz Jan | $270,000 | Evident Title Agency | |
| Henry Roy | $226,000 | First Team Title Llc | |
| Mejia Eva Pelaez | $142,500 | None Available | |
| Patel Anjanaben S | $55,000 | None Available | |
| Osuebi Sylvanus | $98,000 | -- |
Source: Public Records
Mortgage History
| Date | Status | Borrower | Loan Amount |
|---|---|---|---|
| Previous Owner | Henry Roy | $221,906 | |
| Previous Owner | Osuebi Sylvanus | $97,000 |
Source: Public Records
Tax History Compared to Growth
Tax History
| Year | Tax Paid | Tax Assessment Tax Assessment Total Assessment is a certain percentage of the fair market value that is determined by local assessors to be the total taxable value of land and additions on the property. | Land | Improvement |
|---|---|---|---|---|
| 2025 | $6,273 | $99,000 | $46,800 | $52,200 |
| 2024 | $6,160 | $99,000 | $46,800 | $52,200 |
| 2023 | $6,160 | $99,000 | $46,800 | $52,200 |
| 2022 | $5,950 | $99,000 | $46,800 | $52,200 |
| 2021 | $4,115 | $99,000 | $46,800 | $52,200 |
| 2020 | $5,728 | $99,000 | $46,800 | $52,200 |
| 2019 | $5,096 | $89,900 | $46,800 | $43,100 |
| 2018 | $4,991 | $89,900 | $46,800 | $43,100 |
| 2017 | $4,903 | $89,900 | $46,800 | $43,100 |
| 2016 | $4,801 | $89,900 | $46,800 | $43,100 |
| 2015 | $4,719 | $89,900 | $46,800 | $43,100 |
| 2014 | $4,666 | $89,900 | $46,800 | $43,100 |
Source: Public Records
Map
Nearby Homes
- 803 Nassau St
- 44 S Ward St
- 80A Larch Ave
- 80 Larch Ave
- 37 Hazelhurst St
- 82 S Ward St
- 18 N Talmadge St
- 1224 Dogwood Ct
- 15 N Talmadge St
- 50 Columbia Ave
- 147 Rutgers St
- 122 Lawrence St Unit 26
- 72 Comstock St
- 220 Paul Robeson Blvd
- 201 Fulton St
- 200 Talmadge St
- 7 Oakwood Place
- 640 Livingston Ave
- 340 Livingston Ave
- 790 Cranbury Cross Rd
- 572 Nassau St
- 566 Nassau St
- 480 Center St
- 590 Nassau St
- 562 Nassau St
- 541 Allgair Ave
- 481 Center St
- 596 Nassau St
- 565 Allgair Ave
- 556 Nassau St
- 533 Allgair Ave
- 602 Nassau St
- 571 Allgair Ave
- 552 Allgair Ave
- 527 Allgair Ave
- 550 Nassau St
- 545 Allgair Ave
- 558 Allgair Ave
- 608 Nassau St
- 575 Allgair Ave Unit A