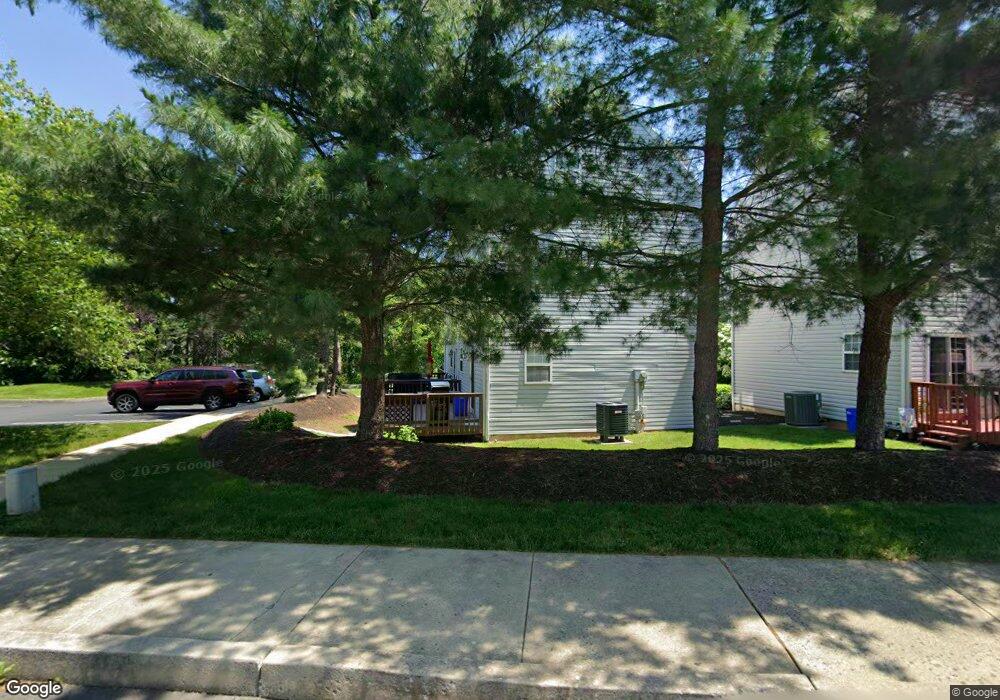
578 Penn St Pennsburg, PA 18073
Estimated Value: $298,000 - $337,000
3
Beds
3
Baths
1,389
Sq Ft
$223/Sq Ft
Est. Value
About This Home
This home is located at 578 Penn St, Pennsburg, PA 18073 and is currently estimated at $309,968, approximately $223 per square foot. 578 Penn St is a home located in Montgomery County with nearby schools including Upper Perkiomen 4th & 5th Grade Center, Upper Perkiomen Middle School, and Upper Perkiomen High School.
Ownership History
Date
Name
Owned For
Owner Type
Purchase Details
Closed on
Dec 28, 2005
Sold by
Irey Sean R and Irey Jennifer L
Bought by
Webb Nancy C
Current Estimated Value
Home Financials for this Owner
Home Financials are based on the most recent Mortgage that was taken out on this home.
Original Mortgage
$95,000
Outstanding Balance
$53,429
Interest Rate
6.28%
Estimated Equity
$256,539
Purchase Details
Closed on
Apr 26, 2002
Sold by
Hallman Keith P and Hallman Christopher M
Bought by
Irey Sean R
Purchase Details
Closed on
Jul 27, 1999
Sold by
Rogers Brian W and Rogers Kimberly A
Bought by
Hallman Keith P and Hallman Christopher M
Purchase Details
Closed on
Oct 31, 1996
Sold by
Pennsburg Townhouse Associates
Bought by
Rogers Brian W and Bartholomew Kimberly A
Create a Home Valuation Report for This Property
The Home Valuation Report is an in-depth analysis detailing your home's value as well as a comparison with similar homes in the area
Home Values in the Area
Average Home Value in this Area
Purchase History
| Date | Buyer | Sale Price | Title Company |
|---|---|---|---|
| Webb Nancy C | $170,000 | -- | |
| Irey Sean R | $114,900 | First American Title Ins Co | |
| Hallman Keith P | $101,000 | -- | |
| Rogers Brian W | $103,405 | -- |
Source: Public Records
Mortgage History
| Date | Status | Borrower | Loan Amount |
|---|---|---|---|
| Open | Webb Nancy C | $95,000 |
Source: Public Records
Tax History Compared to Growth
Tax History
| Year | Tax Paid | Tax Assessment Tax Assessment Total Assessment is a certain percentage of the fair market value that is determined by local assessors to be the total taxable value of land and additions on the property. | Land | Improvement |
|---|---|---|---|---|
| 2025 | $4,147 | $101,610 | $17,360 | $84,250 |
| 2024 | $4,147 | $101,610 | $17,360 | $84,250 |
| 2023 | $3,832 | $101,610 | $17,360 | $84,250 |
| 2022 | $3,787 | $101,610 | $17,360 | $84,250 |
| 2021 | $3,706 | $101,610 | $17,360 | $84,250 |
| 2020 | $3,689 | $101,610 | $17,360 | $84,250 |
| 2019 | $3,619 | $101,610 | $17,360 | $84,250 |
| 2018 | $3,619 | $101,610 | $17,360 | $84,250 |
| 2017 | $3,400 | $101,610 | $17,360 | $84,250 |
| 2016 | $3,360 | $101,610 | $17,360 | $84,250 |
| 2015 | $3,146 | $101,610 | $17,360 | $84,250 |
| 2014 | $3,146 | $101,610 | $17,360 | $84,250 |
Source: Public Records
Map
Nearby Homes
- 772 Main St
- 1042 Rosemont Terrace
- 431 Seminary St
- 419 Seminary St
- 202 Dotts St
- 765 Fawn Way
- 2016 Hidden Meadows Ave
- 716 Deerfield Blvd
- 716 Deerfield Blvd Unit Lot 4
- 714 Deerfield Blvd
- 714 Deerfield Blvd Unit Lot 3
- 708 Deerfield Blvd
- 708 Deerfield Blvd Unit Lot 2
- 1418-1/5 W 4th St
- Daisy Plan at Deerfield - Duplex Homes
- Ivy Plan at Deerfield - Duplex Homes
- White Oak Plan at Deerfield
- Revere Plan at Deerfield
- Emily Plan at Deerfield
- Black Cherry Plan at Deerfield