Estimated Value: $246,000 - $302,000
3
Beds
2
Baths
1,464
Sq Ft
$188/Sq Ft
Est. Value
About This Home
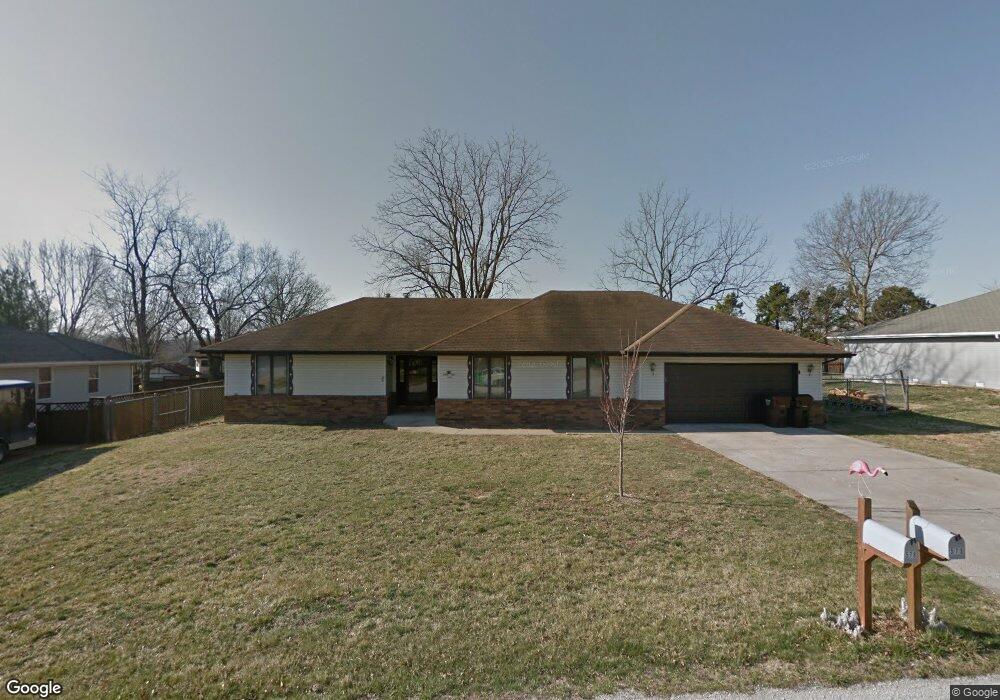
This home is located at 578 Walnut Grove Cir, Nixa, MO 65714 and is currently estimated at $275,040, approximately $187 per square foot. 578 Walnut Grove Cir is a home located in Christian County with nearby schools including High Pointe Elementary School, Summit Intermediate School, and Nixa Junior High School.
Ownership History
Date
Name
Owned For
Owner Type
Purchase Details
Closed on
Aug 8, 2023
Sold by
Chambers Denise W
Bought by
Chambers Denise W
Current Estimated Value
Home Financials for this Owner
Home Financials are based on the most recent Mortgage that was taken out on this home.
Original Mortgage
$199,500
Outstanding Balance
$194,954
Interest Rate
6.81%
Mortgage Type
VA
Estimated Equity
$80,086
Purchase Details
Closed on
Mar 10, 2016
Bought by
Chambers Sarah and Chambers Dennis
Home Financials for this Owner
Home Financials are based on the most recent Mortgage that was taken out on this home.
Original Mortgage
$116,398
Interest Rate
3.68%
Purchase Details
Closed on
Apr 24, 2008
Sold by
Wright Edwin D and Wright Dixie
Bought by
Chambers Dennis W
Home Financials for this Owner
Home Financials are based on the most recent Mortgage that was taken out on this home.
Original Mortgage
$130,752
Interest Rate
5.86%
Mortgage Type
VA
Create a Home Valuation Report for This Property
The Home Valuation Report is an in-depth analysis detailing your home's value as well as a comparison with similar homes in the area
Home Values in the Area
Average Home Value in this Area
Purchase History
| Date | Buyer | Sale Price | Title Company |
|---|---|---|---|
| Chambers Denise W | -- | Title365 | |
| Chambers Denise W | -- | Title365 | |
| Chambers Sarah | -- | -- | |
| Chambers Dennis W | -- | None Available |
Source: Public Records
Mortgage History
| Date | Status | Borrower | Loan Amount |
|---|---|---|---|
| Open | Chambers Denise W | $199,500 | |
| Closed | Chambers Denise W | $199,500 | |
| Previous Owner | Chambers Sarah | $116,398 | |
| Previous Owner | Chambers Sarah | -- | |
| Previous Owner | Chambers Dennis W | $130,752 |
Source: Public Records
Tax History Compared to Growth
Tax History
| Year | Tax Paid | Tax Assessment Tax Assessment Total Assessment is a certain percentage of the fair market value that is determined by local assessors to be the total taxable value of land and additions on the property. | Land | Improvement |
|---|---|---|---|---|
| 2024 | $1,414 | $23,830 | -- | -- |
| 2023 | $1,414 | $23,830 | $0 | $0 |
| 2022 | $1,308 | $22,020 | $0 | $0 |
| 2021 | $1,309 | $22,020 | $0 | $0 |
| 2020 | $1,256 | $20,200 | $0 | $0 |
| 2019 | $1,256 | $20,200 | $0 | $0 |
| 2018 | $1,133 | $19,650 | $0 | $0 |
| 2017 | $1,133 | $19,650 | $0 | $0 |
| 2016 | $1,114 | $19,650 | $0 | $0 |
| 2015 | $1,115 | $19,650 | $19,650 | $0 |
| 2014 | $1,076 | $19,460 | $0 | $0 |
| 2013 | $12 | $19,460 | $0 | $0 |
| 2011 | $12 | $41,720 | $0 | $0 |
Source: Public Records
Map
Nearby Homes
- 824 E Kings Mead Cir Unit 1
- 820 E Brewer Ave
- 1649 N Feather Crest Dr
- 828 E Kings Mead Cir Unit 3
- 2074 Cc Hwy
- 823 E Donegal Cir
- 1653 N Old Castle Rd
- 608 E Penzance Dr
- 1362 N Sandy Creek Cir Unit 4
- 833 E Grouse Rd
- 1398 N Sandy Creek Cir Unit 2
- 1396 N Sandy Creek Cir Unit 2
- 1419 Rich Hill Cir
- 720 E Penzance Cir
- 736 E Penzance Cir
- 1368 N Sandy Creek Cir Unit 4
- 861 Bantry Ct
- 1363 N Maxine Ave
- 870 E Purple Martin St
- 1677 N State Highway Cc
- 568 Walnut Grove Cir
- 588 Walnut Grove Cir
- 0 Walnut Grove Cir
- 1409 Walnut Grove Cir
- 569 E Hillwallen Place
- 1552 Fairway Ln
- 581 E Hillwallen Place
- 579 Walnut Grove Cir
- 598 Walnut Grove Cir
- 589 Walnut Grove Cir
- 569 Walnut Grove Cir
- 593 E Hillwallen Place
- 1563 Fairway Ln
- 599 Walnut Grove Cir
- 1599 Fairway Ln
- 1575 Fairway Ln
- 568 E Hillwallen Place
- 588 E State Highway Cc
- 588 E State Highway Cc Unit Suite 1
- 1507 Fairway Ln