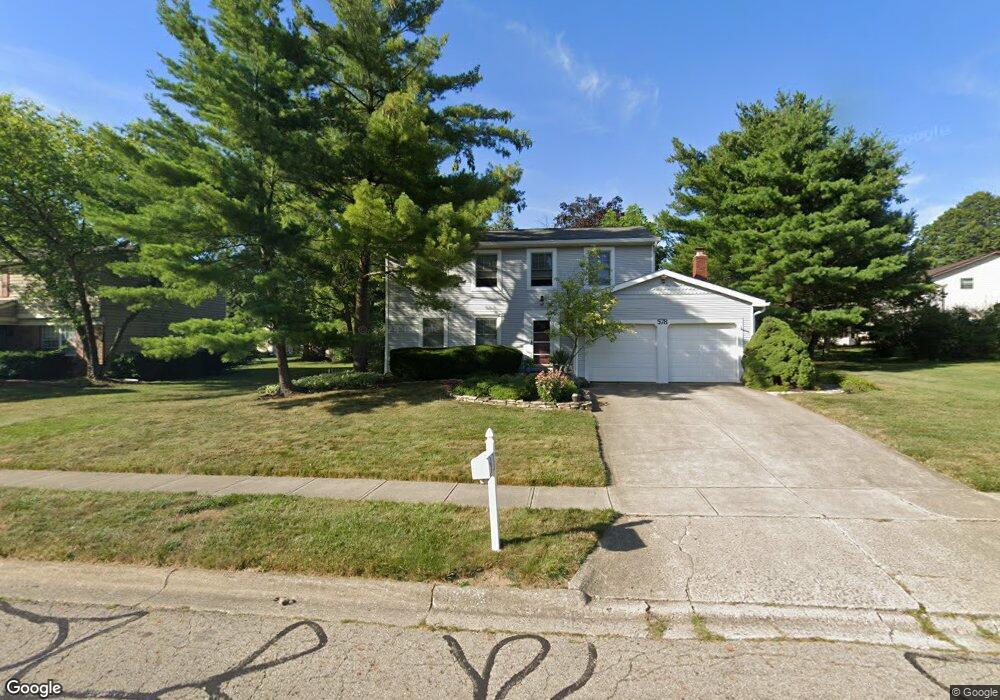
578 Wickham Way Columbus, OH 43230
Estimated Value: $462,848 - $499,000
5
Beds
4
Baths
2,610
Sq Ft
$183/Sq Ft
Est. Value
About This Home
This home is located at 578 Wickham Way, Columbus, OH 43230 and is currently estimated at $476,962, approximately $182 per square foot. 578 Wickham Way is a home located in Franklin County with nearby schools including Jefferson Elementary School, Gahanna East Middle School, and Lincoln High School.
Ownership History
Date
Name
Owned For
Owner Type
Purchase Details
Closed on
Aug 20, 2010
Sold by
M H Murphy Development Company
Bought by
Prince Richard K and Prince Barbara S
Current Estimated Value
Home Financials for this Owner
Home Financials are based on the most recent Mortgage that was taken out on this home.
Original Mortgage
$159,920
Outstanding Balance
$104,380
Interest Rate
4.6%
Mortgage Type
New Conventional
Estimated Equity
$372,582
Purchase Details
Closed on
Feb 19, 2010
Sold by
Bolon Nora L
Bought by
Mh Murphy Development Company
Purchase Details
Closed on
May 24, 1982
Bought by
Bolon Mark W and Bolon Nora L
Purchase Details
Closed on
Jun 1, 1977
Create a Home Valuation Report for This Property
The Home Valuation Report is an in-depth analysis detailing your home's value as well as a comparison with similar homes in the area
Purchase History
| Date | Buyer | Sale Price | Title Company |
|---|---|---|---|
| Prince Richard K | $199,900 | Stewart Tit | |
| Mh Murphy Development Company | $209,900 | Stewart Tit | |
| Bolon Mark W | -- | -- | |
| -- | $51,000 | -- |
Source: Public Records
Mortgage History
| Date | Status | Borrower | Loan Amount |
|---|---|---|---|
| Open | Prince Richard K | $159,920 |
Source: Public Records
Tax History
| Year | Tax Paid | Tax Assessment Tax Assessment Total Assessment is a certain percentage of the fair market value that is determined by local assessors to be the total taxable value of land and additions on the property. | Land | Improvement |
|---|---|---|---|---|
| 2025 | $8,073 | $137,030 | $35,000 | $102,030 |
| 2024 | $8,073 | $137,030 | $35,000 | $102,030 |
| 2023 | $7,971 | $137,025 | $35,000 | $102,025 |
| 2022 | $6,741 | $90,270 | $12,920 | $77,350 |
| 2021 | $6,520 | $90,270 | $12,920 | $77,350 |
| 2020 | $6,465 | $90,270 | $12,920 | $77,350 |
| 2019 | $5,409 | $75,360 | $10,780 | $64,580 |
| 2018 | $5,236 | $75,360 | $10,780 | $64,580 |
| 2017 | $5,031 | $75,360 | $10,780 | $64,580 |
| 2016 | $5,098 | $70,490 | $14,910 | $55,580 |
| 2015 | $5,103 | $70,490 | $14,910 | $55,580 |
| 2014 | $5,063 | $70,490 | $14,910 | $55,580 |
| 2013 | $2,489 | $69,790 | $14,210 | $55,580 |
Source: Public Records
Map
Nearby Homes
- 481 Clotts Rd
- 365 Sycamore Woods Ln Unit 365
- 667 Salt Lick Ln
- 302 Zander Ln Unit 302
- 875 Pinnacle Pointe Place Unit 32
- 219 N Hamilton Rd
- 636 Pincay Place
- 4220 E Johnstown Rd
- 206 Lintner St
- 846 Aylesbury Dr
- 62 Saint Stephens Ct
- 0 Beecher Crossing
- 108 Walcreek Dr W
- 140 Walnut St
- 370 Beecher Rd
- 524 Mechwart Place Unit 524
- 971 Bryn Mawr Dr
- 1126 Sanctuary Place Unit 4
- 169 Flint Ridge Dr
- 505 Serenity Dr Unit 13
- 580 Wickham Way
- 517 Stedway Ct
- 525 Stedway Ct
- 519 Haversham Dr
- 577 Wickham Way
- 533 Stedway Ct
- 575 Wickham Way
- 511 Haversham Dr
- 579 Wickham Way
- 527 Haversham Dr
- 541 Stedway Ct
- 573 Wickham Way
- 581 Wickham Way
- 535 Haversham Dr
- 508 Stedway Ct
- 524 Stedway Ct
- 551 Stedway Ct
- 542 Tresham Rd
- 571 Wickham Way
- 516 Stedway Ct
Your Personal Tour Guide
Ask me questions while you tour the home.