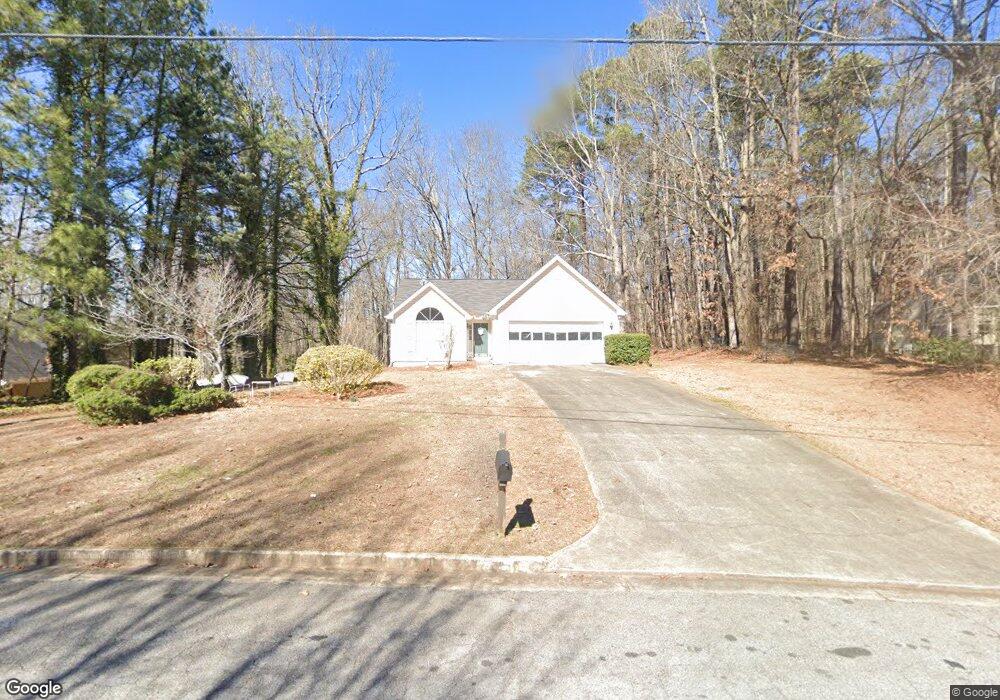
5780 Shoal Creek Dr Douglasville, GA 30135
Fouts Mill NeighborhoodEstimated Value: $255,000 - $275,000
3
Beds
2
Baths
1,416
Sq Ft
$188/Sq Ft
Est. Value
About This Home
This home is located at 5780 Shoal Creek Dr, Douglasville, GA 30135 and is currently estimated at $266,413, approximately $188 per square foot. 5780 Shoal Creek Dr is a home located in Douglas County with nearby schools including Dorsett Shoals Elementary School, Yeager Middle School, and Chapel Hill High School.
Ownership History
Date
Name
Owned For
Owner Type
Purchase Details
Closed on
Sep 26, 2002
Sold by
Morrison Michael R
Bought by
Johnston Stewart M and Johnston Sharon G
Current Estimated Value
Home Financials for this Owner
Home Financials are based on the most recent Mortgage that was taken out on this home.
Original Mortgage
$87,100
Interest Rate
6.01%
Mortgage Type
New Conventional
Purchase Details
Closed on
Aug 20, 1998
Sold by
Kaczmarek Craig T and Kaczmarek Katherine A
Bought by
Morrison Michael Ryan
Home Financials for this Owner
Home Financials are based on the most recent Mortgage that was taken out on this home.
Original Mortgage
$98,722
Interest Rate
6.95%
Mortgage Type
FHA
Purchase Details
Closed on
Mar 31, 1994
Sold by
Pineland Homes
Bought by
Kaczmarek Craig T Katherine
Home Financials for this Owner
Home Financials are based on the most recent Mortgage that was taken out on this home.
Original Mortgage
$78,074
Interest Rate
8.07%
Mortgage Type
FHA
Create a Home Valuation Report for This Property
The Home Valuation Report is an in-depth analysis detailing your home's value as well as a comparison with similar homes in the area
Home Values in the Area
Average Home Value in this Area
Purchase History
| Date | Buyer | Sale Price | Title Company |
|---|---|---|---|
| Johnston Stewart M | $108,900 | -- | |
| Morrison Michael Ryan | $100,000 | -- | |
| Kaczmarek Craig T Katherine | $79,300 | -- |
Source: Public Records
Mortgage History
| Date | Status | Borrower | Loan Amount |
|---|---|---|---|
| Closed | Johnston Stewart M | $87,100 | |
| Previous Owner | Morrison Michael Ryan | $98,722 | |
| Previous Owner | Kaczmarek Craig T Katherine | $78,074 |
Source: Public Records
Tax History Compared to Growth
Tax History
| Year | Tax Paid | Tax Assessment Tax Assessment Total Assessment is a certain percentage of the fair market value that is determined by local assessors to be the total taxable value of land and additions on the property. | Land | Improvement |
|---|---|---|---|---|
| 2024 | $393 | $86,960 | $27,200 | $59,760 |
| 2023 | $393 | $83,720 | $24,160 | $59,560 |
| 2022 | $406 | $77,440 | $17,640 | $59,800 |
| 2021 | $406 | $57,400 | $16,000 | $41,400 |
| 2020 | $397 | $57,400 | $16,000 | $41,400 |
| 2019 | $333 | $58,040 | $14,880 | $43,160 |
| 2018 | $333 | $50,880 | $13,440 | $37,440 |
| 2017 | $348 | $44,840 | $12,960 | $31,880 |
| 2016 | $362 | $42,520 | $12,600 | $29,920 |
| 2015 | $377 | $41,200 | $12,600 | $28,600 |
| 2014 | $400 | $34,080 | $11,040 | $23,040 |
| 2013 | -- | $35,160 | $11,400 | $23,760 |
Source: Public Records
Map
Nearby Homes
- 5784 Shoal Creek Dr
- 5776 Shoal Creek Dr
- 5788 Shoal Creek Dr
- 5773 Shoal Creek Dr
- 5772 Shoal Creek Dr
- 5792 Shoal Creek Dr
- 5785 Shoal Creek Dr
- 5769 Shoal Creek Dr
- 5768 Shoal Creek Dr
- 5739 Dorsett Shoals Rd
- 5796 Shoal Creek Dr
- 0 Shoal Creek Dr Unit 7080672
- 0 Shoal Creek Dr Unit 3235815
- 0 Shoal Creek Dr Unit 3122953
- 0 Shoal Creek Dr Unit 8781218
- 0 Shoal Creek Dr Unit 8578730
- 0 Shoal Creek Dr Unit 8234393
- 5826 Shoal Creek Dr
- 5765 Shoal Creek Dr
- 5764 Shoal Creek Dr