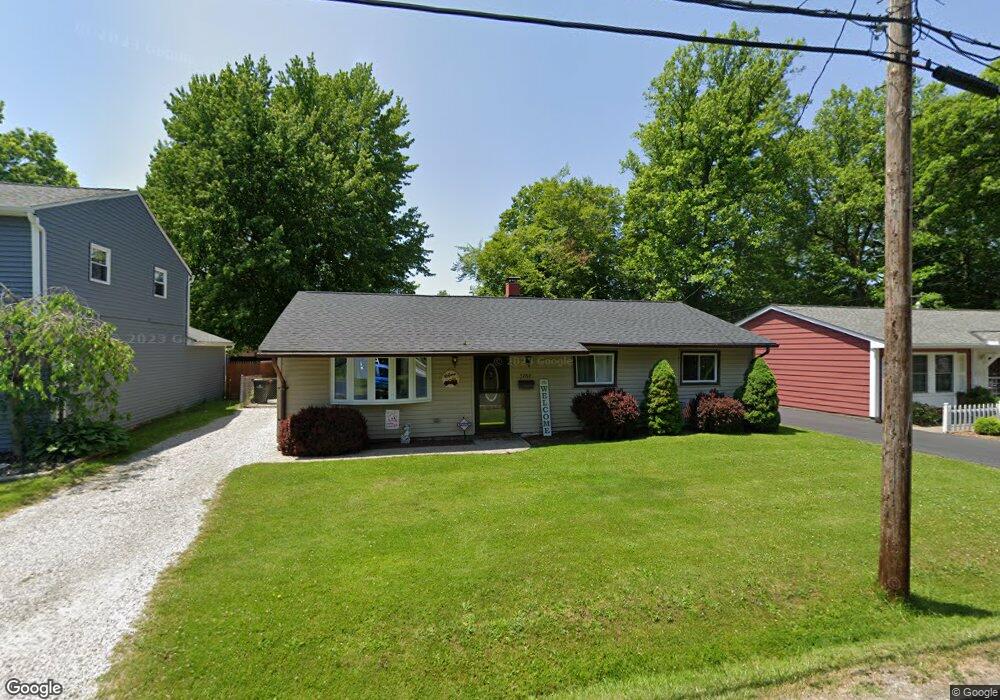
5782 Beech Dr Mentor On the Lake, OH 44060
Estimated Value: $193,989 - $209,000
3
Beds
2
Baths
1,504
Sq Ft
$133/Sq Ft
Est. Value
About This Home
This home is located at 5782 Beech Dr, Mentor On the Lake, OH 44060 and is currently estimated at $199,747, approximately $132 per square foot. 5782 Beech Dr is a home located in Lake County with nearby schools including Lake Elementary School, Shore Middle School, and Mentor High School.
Ownership History
Date
Name
Owned For
Owner Type
Purchase Details
Closed on
Feb 28, 2019
Sold by
Miller Tracy R and Curry Michael D
Bought by
Curry Michael D and Curry Tracy R
Current Estimated Value
Home Financials for this Owner
Home Financials are based on the most recent Mortgage that was taken out on this home.
Original Mortgage
$35,000
Outstanding Balance
$26,715
Interest Rate
4.3%
Mortgage Type
Credit Line Revolving
Estimated Equity
$173,032
Purchase Details
Closed on
Feb 5, 2009
Sold by
Curry Tracy R and Curry Michael D
Bought by
Curry Michael D and Curry Tracy R
Home Financials for this Owner
Home Financials are based on the most recent Mortgage that was taken out on this home.
Original Mortgage
$108,211
Interest Rate
4.83%
Mortgage Type
FHA
Purchase Details
Closed on
Feb 15, 1999
Sold by
Miller Jeffrey A
Bought by
Miller Tracy R
Purchase Details
Closed on
Jul 26, 1989
Bought by
Miller Jeffrey A
Create a Home Valuation Report for This Property
The Home Valuation Report is an in-depth analysis detailing your home's value as well as a comparison with similar homes in the area
Home Values in the Area
Average Home Value in this Area
Purchase History
| Date | Buyer | Sale Price | Title Company |
|---|---|---|---|
| Curry Michael D | -- | Lake County Title Llc | |
| Curry Michael D | -- | Competitive Title | |
| Miller Tracy R | -- | -- | |
| Miller Jeffrey A | $54,900 | -- |
Source: Public Records
Mortgage History
| Date | Status | Borrower | Loan Amount |
|---|---|---|---|
| Open | Curry Michael D | $35,000 | |
| Closed | Curry Michael D | $108,211 |
Source: Public Records
Tax History Compared to Growth
Tax History
| Year | Tax Paid | Tax Assessment Tax Assessment Total Assessment is a certain percentage of the fair market value that is determined by local assessors to be the total taxable value of land and additions on the property. | Land | Improvement |
|---|---|---|---|---|
| 2024 | -- | $61,880 | $14,510 | $47,370 |
| 2023 | $6,220 | $48,610 | $12,300 | $36,310 |
| 2022 | $2,760 | $48,610 | $12,300 | $36,310 |
| 2021 | $2,767 | $48,610 | $12,300 | $36,310 |
| 2020 | $2,553 | $39,840 | $10,080 | $29,760 |
| 2019 | $2,555 | $39,840 | $10,080 | $29,760 |
| 2018 | $2,593 | $38,840 | $10,890 | $27,950 |
| 2017 | $2,636 | $38,840 | $10,890 | $27,950 |
| 2016 | $2,623 | $38,840 | $10,890 | $27,950 |
| 2015 | $2,393 | $38,840 | $10,890 | $27,950 |
| 2014 | $2,421 | $38,840 | $10,890 | $27,950 |
| 2013 | $2,275 | $38,840 | $10,890 | $27,950 |
Source: Public Records
Map
Nearby Homes
- 5758 Beech Dr
- 7568 Monterey Bay Dr Unit 4
- 7567 Monterey Bay Dr Unit 4
- 7686 Pinehurst Dr
- V/L Andrews Rd
- 5656 Park St
- 7429 Salida Rd
- 7632 Primrose Dr
- 5602 Park Ave
- 5598-A-4 Sea Glass Ln
- 5598-C-3 Sea Glass Ln
- Spencer Plan at Cranes Landing
- Juniper w/ Finished Basement Plan at Cranes Landing
- 7897 Richwood Dr
- 7763 Manor Dr
- 7379 Larkspur Dr
- 7514 Brambleside Ln
- 8050 Harbor Creek Dr Unit 2402
- 8050 Harbor Creek Dr Unit 3001
- 8050 Harbor Creek Dr Unit 1903