Estimated Value: $409,549 - $461,000
4
Beds
1
Bath
1,280
Sq Ft
$342/Sq Ft
Est. Value
About This Home
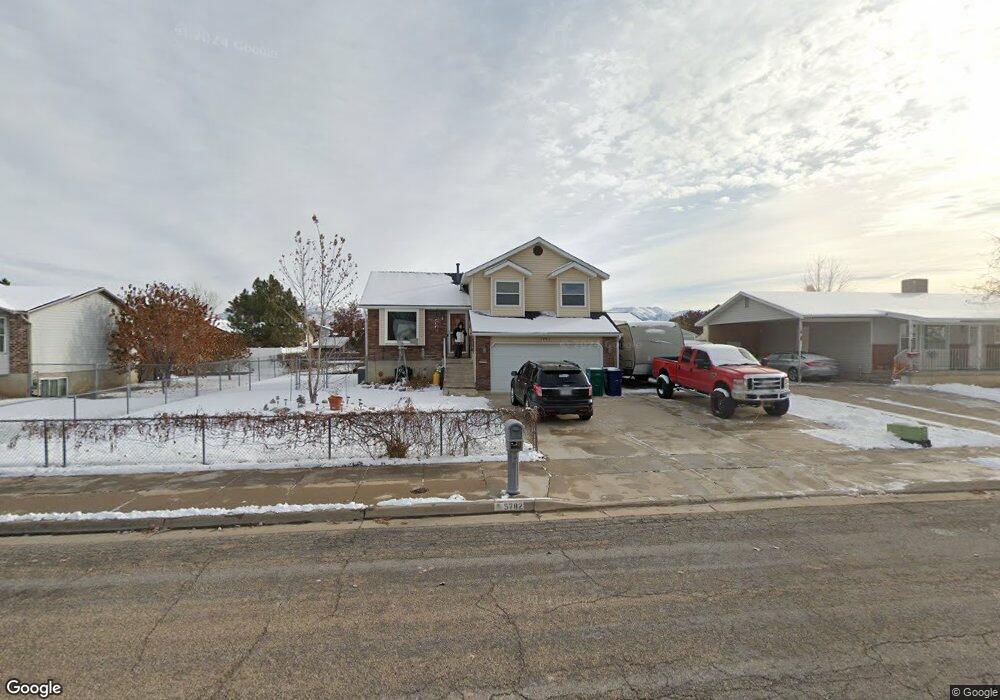
This home is located at 5782 S 4025 W, Roy, UT 84067 and is currently estimated at $438,387, approximately $342 per square foot. 5782 S 4025 W is a home located in Weber County with nearby schools including Freedom School, Roy Junior High School, and Roy High School.
Ownership History
Date
Name
Owned For
Owner Type
Purchase Details
Closed on
Nov 10, 2009
Sold by
Gallegos Kelly C
Bought by
Gallegos Kelly C and Gallegos Carol L
Current Estimated Value
Home Financials for this Owner
Home Financials are based on the most recent Mortgage that was taken out on this home.
Original Mortgage
$134,310
Outstanding Balance
$87,340
Interest Rate
4.92%
Mortgage Type
FHA
Estimated Equity
$351,047
Purchase Details
Closed on
Oct 12, 2007
Sold by
Gallegos Kelly Cruz and Gallegos Carol Lynn
Bought by
Gallegos Kelly C and Gallegos Carol L
Home Financials for this Owner
Home Financials are based on the most recent Mortgage that was taken out on this home.
Original Mortgage
$112,411
Interest Rate
6.42%
Mortgage Type
New Conventional
Purchase Details
Closed on
Feb 12, 1999
Sold by
Mccrone Shirley
Bought by
Gallegos Kelly Cruz and Gallegos Carol Lynn
Home Financials for this Owner
Home Financials are based on the most recent Mortgage that was taken out on this home.
Original Mortgage
$120,000
Interest Rate
6.78%
Mortgage Type
Seller Take Back
Create a Home Valuation Report for This Property
The Home Valuation Report is an in-depth analysis detailing your home's value as well as a comparison with similar homes in the area
Home Values in the Area
Average Home Value in this Area
Purchase History
| Date | Buyer | Sale Price | Title Company |
|---|---|---|---|
| Gallegos Kelly C | -- | Accommodation | |
| Gallegos Kelly C | -- | Backman Ntp | |
| Gallegos Kelly C | -- | Backman | |
| Gallegos Kelly Cruz | -- | -- |
Source: Public Records
Mortgage History
| Date | Status | Borrower | Loan Amount |
|---|---|---|---|
| Open | Gallegos Kelly C | $134,310 | |
| Closed | Gallegos Kelly C | $112,411 | |
| Closed | Gallegos Kelly Cruz | $120,000 |
Source: Public Records
Tax History Compared to Growth
Tax History
| Year | Tax Paid | Tax Assessment Tax Assessment Total Assessment is a certain percentage of the fair market value that is determined by local assessors to be the total taxable value of land and additions on the property. | Land | Improvement |
|---|---|---|---|---|
| 2025 | $2,295 | $406,564 | $135,000 | $271,564 |
| 2024 | $2,219 | $217,799 | $74,257 | $143,542 |
| 2023 | $2,137 | $210,100 | $65,968 | $144,132 |
| 2022 | $2,383 | $238,700 | $60,501 | $178,199 |
| 2021 | $1,793 | $298,000 | $80,017 | $217,983 |
| 2020 | $1,642 | $250,000 | $80,017 | $169,983 |
| 2019 | $1,704 | $245,000 | $45,048 | $199,952 |
| 2018 | $1,567 | $213,000 | $39,924 | $173,076 |
| 2017 | $1,475 | $189,000 | $39,924 | $149,076 |
| 2016 | $1,366 | $94,377 | $21,415 | $72,962 |
| 2015 | $1,155 | $82,308 | $21,415 | $60,893 |
| 2014 | $1,096 | $77,217 | $18,611 | $58,606 |
Source: Public Records
Map
Nearby Homes