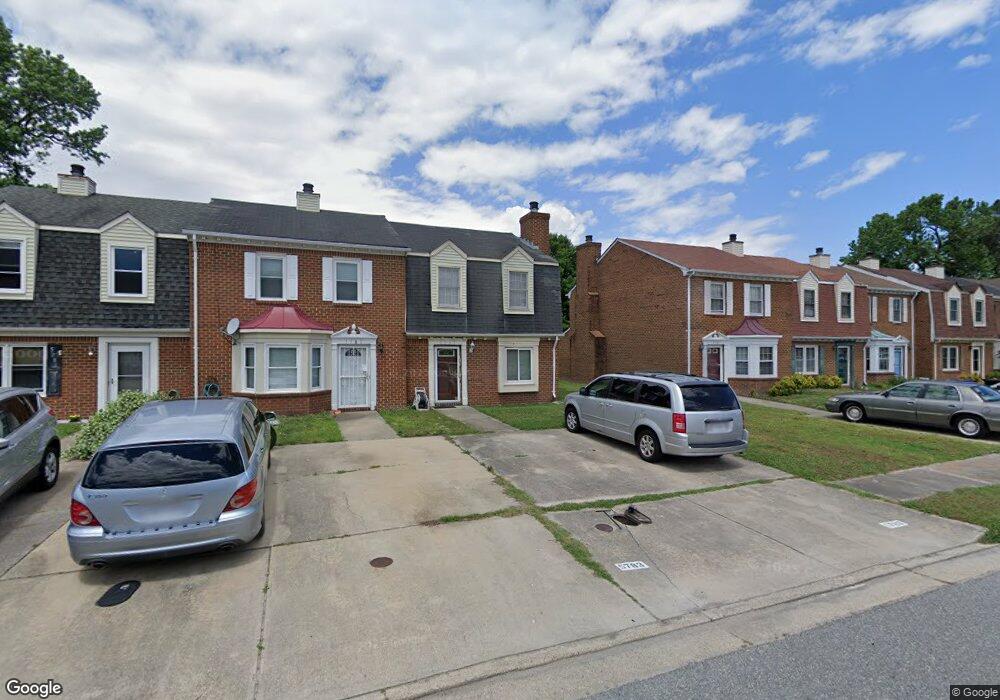
5783 Rivermill Cir Portsmouth, VA 23703
Churchland NeighborhoodEstimated Value: $199,000 - $214,000
3
Beds
2
Baths
1,260
Sq Ft
$164/Sq Ft
Est. Value
About This Home
This home is located at 5783 Rivermill Cir, Portsmouth, VA 23703 and is currently estimated at $206,013, approximately $163 per square foot. 5783 Rivermill Cir is a home located in Portsmouth City with nearby schools including Churchland Primary/Intermediate School, Churchland Middle School, and Churchland High School.
Ownership History
Date
Name
Owned For
Owner Type
Purchase Details
Closed on
Oct 13, 2022
Sold by
Wilson Lorenetta C
Bought by
Wilson Lorenetta C and Wilson Levern
Current Estimated Value
Home Financials for this Owner
Home Financials are based on the most recent Mortgage that was taken out on this home.
Original Mortgage
$141,432
Outstanding Balance
$135,913
Interest Rate
6.02%
Mortgage Type
FHA
Estimated Equity
$70,100
Purchase Details
Closed on
Feb 16, 2005
Sold by
Hardison Clintonia
Bought by
Tucker Lorenetta
Home Financials for this Owner
Home Financials are based on the most recent Mortgage that was taken out on this home.
Original Mortgage
$22,180
Interest Rate
5.14%
Mortgage Type
Stand Alone Second
Purchase Details
Closed on
Nov 7, 2001
Sold by
Sec Housing And Urban Dev
Bought by
Hardison Clintonia
Home Financials for this Owner
Home Financials are based on the most recent Mortgage that was taken out on this home.
Original Mortgage
$69,700
Interest Rate
6.66%
Mortgage Type
FHA
Create a Home Valuation Report for This Property
The Home Valuation Report is an in-depth analysis detailing your home's value as well as a comparison with similar homes in the area
Home Values in the Area
Average Home Value in this Area
Purchase History
| Date | Buyer | Sale Price | Title Company |
|---|---|---|---|
| Wilson Lorenetta C | -- | Westcor Land Title | |
| Tucker Lorenetta | $110,900 | -- | |
| Hardison Clintonia | $65,000 | -- |
Source: Public Records
Mortgage History
| Date | Status | Borrower | Loan Amount |
|---|---|---|---|
| Open | Wilson Lorenetta C | $141,432 | |
| Previous Owner | Tucker Lorenetta | $22,180 | |
| Previous Owner | Tucker Lorenetta | $88,720 | |
| Previous Owner | Hardison Clintonia | $69,700 |
Source: Public Records
Tax History Compared to Growth
Tax History
| Year | Tax Paid | Tax Assessment Tax Assessment Total Assessment is a certain percentage of the fair market value that is determined by local assessors to be the total taxable value of land and additions on the property. | Land | Improvement |
|---|---|---|---|---|
| 2025 | $2,131 | $174,840 | $51,000 | $123,840 |
| 2024 | $2,131 | $159,310 | $45,000 | $114,310 |
| 2023 | $2,043 | $149,790 | $45,000 | $104,790 |
| 2022 | $1,857 | $142,880 | $40,000 | $102,880 |
| 2021 | $1,623 | $124,880 | $22,000 | $102,880 |
| 2020 | $1,563 | $120,200 | $22,000 | $98,200 |
| 2019 | $1,463 | $112,530 | $19,000 | $93,530 |
| 2018 | $1,487 | $114,400 | $22,880 | $91,520 |
| 2017 | $1,487 | $114,400 | $22,880 | $91,520 |
| 2016 | $1,487 | $114,400 | $22,880 | $91,520 |
| 2015 | $1,487 | $114,400 | $22,880 | $91,520 |
| 2014 | $1,514 | $119,210 | $22,880 | $96,330 |
Source: Public Records
Map
Nearby Homes
- 5693 Rivermill Cir
- 5728 Hawthorne Ln
- 5606 Gregory Ct
- 4444 Southampton Arch
- 4232 Summerset Dr
- 5833 Hawthorne Ln
- 4619 River Shore Rd
- 4224 Burnham Dr
- 21 Windy Pines Crescent
- 4200 Quince Rd
- 4028 Swannanoa Dr
- 4726 River Shore Rd
- 8 Compass Ct
- 5807 Dunkin St
- 4100 Mayfair Way
- 4008 Oakhurst Rd
- 17 Shoal Ct
- 4071 Long Point Blvd
- 3433 Willow Breeze Dr
- 6750 Burbage Landing Cir
- 5785 Rivermill Cir
- 5781 Rivermill Cir
- 5787 Rivermill Cir
- 5779 Rivermill Cir
- 5789 Rivermill Cir
- 5777 Rivermill Cir
- 5791 Rivermill Cir
- 5775 Rivermill Cir
- 5793 Rivermill Cir
- 5773 Rivermill Cir
- 5771 Rivermill Cir
- 5795 Rivermill Cir
- 5769 Rivermill Cir
- 5776 Rivermill Cir
- 5778 Rivermill Cir
- 5774 Rivermill Cir
- 5780 Rivermill Cir
- 5801 Rivermill Cir
- 5772 Rivermill Cir
- 5782 Rivermill Cir