5786 Ravine Creek Dr Unit 5-5786 Grove City, OH 43123
Estimated Value: $299,000 - $328,000
3
Beds
2
Baths
1,446
Sq Ft
$215/Sq Ft
Est. Value
About This Home
This home is located at 5786 Ravine Creek Dr Unit 5-5786, Grove City, OH 43123 and is currently estimated at $310,707, approximately $214 per square foot. 5786 Ravine Creek Dr Unit 5-5786 is a home located in Franklin County with nearby schools including Buckeye Woods Elementary School, Hayes Intermediate School, and Jackson Middle School.
Ownership History
Date
Name
Owned For
Owner Type
Purchase Details
Closed on
Jun 10, 2013
Sold by
Ferguson Carolyn
Bought by
Ferguson Kevin M and Ferguson Joelle L
Current Estimated Value
Purchase Details
Closed on
Sep 25, 2009
Sold by
Ferguson Kerry and Ferguson April
Bought by
Ferguson Carolyn
Home Financials for this Owner
Home Financials are based on the most recent Mortgage that was taken out on this home.
Original Mortgage
$119,800
Interest Rate
5.15%
Mortgage Type
New Conventional
Purchase Details
Closed on
Aug 28, 2009
Sold by
Schroeder Thomas E H and Estate Of Willa Tea Carolina S
Bought by
Ferguson Kevin and Ferguson Kerry
Home Financials for this Owner
Home Financials are based on the most recent Mortgage that was taken out on this home.
Original Mortgage
$119,800
Interest Rate
5.15%
Mortgage Type
New Conventional
Purchase Details
Closed on
Sep 29, 1999
Sold by
The Epcon Group Inc
Bought by
Schroeder G W F and Schroeder T C W
Create a Home Valuation Report for This Property
The Home Valuation Report is an in-depth analysis detailing your home's value as well as a comparison with similar homes in the area
Home Values in the Area
Average Home Value in this Area
Purchase History
| Date | Buyer | Sale Price | Title Company |
|---|---|---|---|
| Ferguson Kevin M | $130,000 | Independent Title Box | |
| Ferguson Carolyn | $133,300 | Expedient | |
| Ferguson Kevin | $134,900 | Expedient | |
| Schroeder G W F | $163,900 | Chicago Title |
Source: Public Records
Mortgage History
| Date | Status | Borrower | Loan Amount |
|---|---|---|---|
| Closed | Ferguson Carolyn | $119,800 |
Source: Public Records
Tax History Compared to Growth
Tax History
| Year | Tax Paid | Tax Assessment Tax Assessment Total Assessment is a certain percentage of the fair market value that is determined by local assessors to be the total taxable value of land and additions on the property. | Land | Improvement |
|---|---|---|---|---|
| 2024 | $3,650 | $80,260 | $15,750 | $64,510 |
| 2023 | $3,598 | $80,255 | $15,750 | $64,505 |
| 2022 | $4,113 | $67,450 | $8,890 | $58,560 |
| 2021 | $4,193 | $67,450 | $8,890 | $58,560 |
| 2020 | $4,179 | $67,450 | $8,890 | $58,560 |
| 2019 | $3,465 | $51,880 | $6,830 | $45,050 |
| 2018 | $3,401 | $51,880 | $6,830 | $45,050 |
| 2017 | $3,394 | $51,880 | $6,830 | $45,050 |
| 2016 | $3,349 | $46,210 | $7,390 | $38,820 |
| 2015 | $3,350 | $46,210 | $7,390 | $38,820 |
| 2014 | $3,353 | $46,210 | $7,390 | $38,820 |
| 2013 | $1,365 | $48,615 | $7,770 | $40,845 |
Source: Public Records
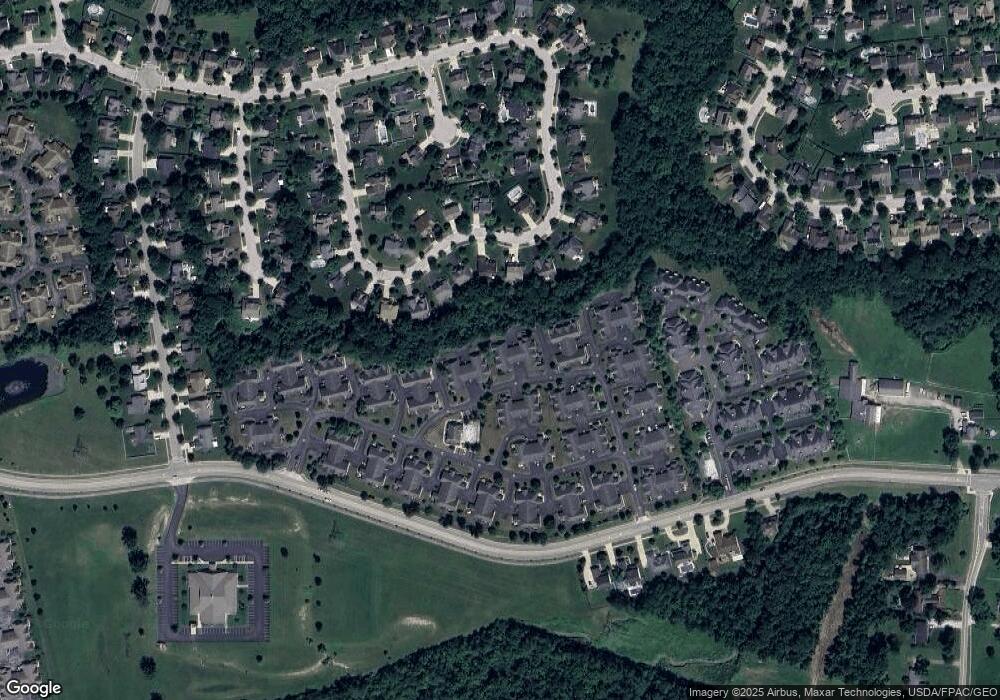
Map
Nearby Homes
- 5796 Ravine Creek Dr
- 2310 Ravine Woods Dr Unit 22
- 5870 Crooked Creek Blvd Unit 5870
- 2336 Willowside Ln Unit 2336
- 5655 Lotus Ct
- 2383 Birch Bark Trail
- 2504 Landings Way Unit 52504
- 2384 Birch Bark Trail
- 2051 Borror Rd
- 2382 Clover Blossom Ct
- 5933 Landings Pond Place Unit 21
- 5941 Landings Pond Place
- 2609 Landings Way Unit 29-D
- 2305 Spring Cress Ave
- 5793 Daffodil Ct
- 2433 Stargrass Ave
- 0 London Groveport Rd Unit 225019366
- 2335 Fernwood Ave
- 5712 Buckeye Pkwy
- 5455 Lilac Ave
- 5786 Ravine Creek Dr
- 5778 Ravine Creek Dr
- 5778 Ravine Creek Dr Unit 15
- 5772 Ravine Creek Dr
- 5764 Ravine Creek Dr
- 5782 Ravine Creek Dr
- 5768 Ravine Creek Dr
- 5760 Ravine Creek Dr
- 5773 Ravine Creek Dr
- 5773 Ravine Creek Dr Unit A10
- 5773 Ravine Creek Dr Unit 23-577
- 5800 Ravine Creek Dr
- 5777 Ravine Creek Dr
- 2172 Ravine Woods Dr Unit 2172
- 5808 Ravine Creek Dr
- 2168 Ravine Woods Dr
- 5801 Ravine Creek Dr
- 5801 Ravine Creek Dr Unit 26
- 5754 Ravine Creek Dr
- 5804 Ravine Creek Dr