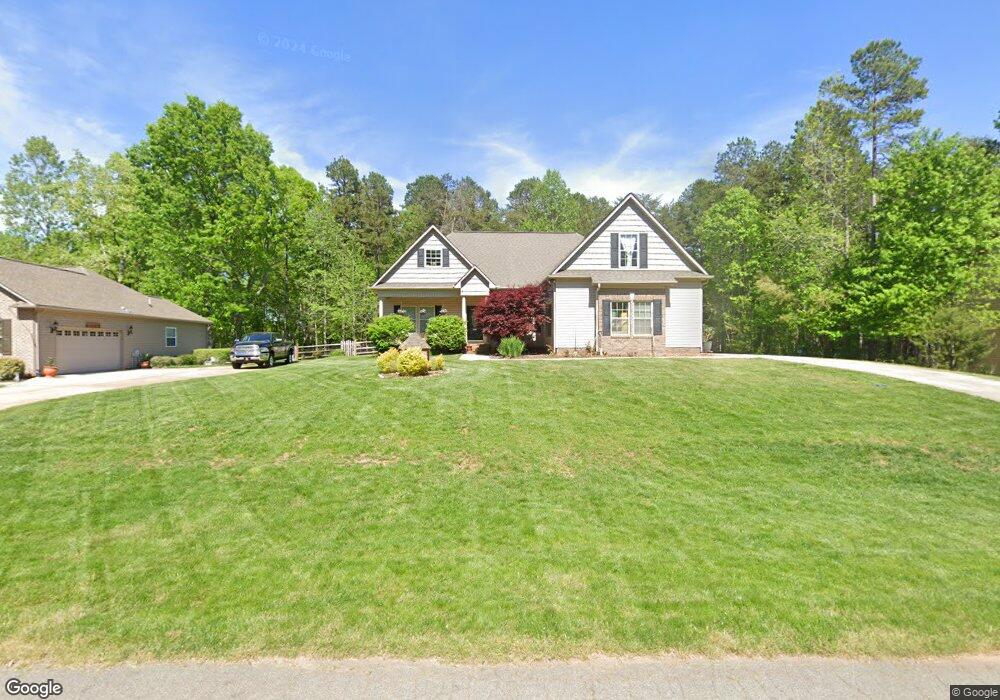
5787 Cedar Run Rd Denver, NC 28037
Estimated Value: $456,000 - $551,000
3
Beds
2
Baths
1,767
Sq Ft
$276/Sq Ft
Est. Value
About This Home
This home is located at 5787 Cedar Run Rd, Denver, NC 28037 and is currently estimated at $488,289, approximately $276 per square foot. 5787 Cedar Run Rd is a home located in Lincoln County with nearby schools including Pumpkin Center Primary, Pumpkin Center Intermediate, and North Lincoln Middle School.
Ownership History
Date
Name
Owned For
Owner Type
Purchase Details
Closed on
May 15, 2007
Sold by
Colicchio Joseph and Farabaugh Sandra
Bought by
Kenseth Stephen F and Kenseth Dana F
Current Estimated Value
Home Financials for this Owner
Home Financials are based on the most recent Mortgage that was taken out on this home.
Original Mortgage
$189,200
Outstanding Balance
$116,335
Interest Rate
6.37%
Mortgage Type
Assumption
Estimated Equity
$371,954
Purchase Details
Closed on
Mar 28, 2006
Sold by
Ingle Builders Llc
Bought by
Colicchio Joseph and Farabaugh Sandra
Home Financials for this Owner
Home Financials are based on the most recent Mortgage that was taken out on this home.
Original Mortgage
$178,320
Interest Rate
6.29%
Mortgage Type
New Conventional
Purchase Details
Closed on
Jan 5, 2005
Sold by
C Trac Enterprises Inc
Bought by
Ingle Builders Inc
Create a Home Valuation Report for This Property
The Home Valuation Report is an in-depth analysis detailing your home's value as well as a comparison with similar homes in the area
Purchase History
| Date | Buyer | Sale Price | Title Company |
|---|---|---|---|
| Kenseth Stephen F | $23,700 | None Available | |
| Colicchio Joseph | $223,000 | None Available | |
| Ingle Builders Inc | $49,000 | None Available |
Source: Public Records
Mortgage History
| Date | Status | Borrower | Loan Amount |
|---|---|---|---|
| Open | Kenseth Stephen F | $189,200 | |
| Previous Owner | Colicchio Joseph | $178,320 |
Source: Public Records
Tax History
| Year | Tax Paid | Tax Assessment Tax Assessment Total Assessment is a certain percentage of the fair market value that is determined by local assessors to be the total taxable value of land and additions on the property. | Land | Improvement |
|---|---|---|---|---|
| 2025 | $2,690 | $421,524 | $42,643 | $378,881 |
| 2024 | $2,662 | $421,524 | $42,643 | $378,881 |
| 2023 | $2,662 | $421,524 | $42,643 | $378,881 |
| 2022 | $2,023 | $257,531 | $26,796 | $230,735 |
| 2021 | $2,005 | $257,531 | $26,796 | $230,735 |
| 2020 | $1,839 | $257,531 | $26,796 | $230,735 |
| 2019 | $1,839 | $257,531 | $26,796 | $230,735 |
| 2018 | $1,748 | $226,911 | $24,990 | $201,921 |
| 2017 | $1,647 | $226,911 | $24,990 | $201,921 |
| 2016 | $1,642 | $226,911 | $24,990 | $201,921 |
| 2015 | $1,695 | $226,911 | $24,990 | $201,921 |
| 2014 | $1,589 | $212,802 | $36,684 | $176,118 |
Source: Public Records
Map
Nearby Homes
- 6315 Wingate Hill Rd
- 1A Hidden Forest Dr Unit 1A
- 1915 Beth Haven Church Rd
- 6603 Havencrest Dr
- 2184 Beth Haven Church Rd
- 4 Beth Haven Church Rd
- 3 Beth Haven Church Rd
- 6335 Forney Hill Rd
- 00 Oak Hill Ct Unit 13B
- 5406 Christopher Rd
- 5345 Christopher Rd
- 6532 Kidville Rd
- 5004 King Wilkinson Rd
- 2572 Norton Ave
- 5321 Vesuvius Furnace Rd
- 6221 King Wilkinson Rd
- 6352 Willow Farm Dr
- 2263 Lee Lawing Rd
- 2271 Lee Lawing Rd
- 0 King Wilkinson Rd Unit 2
- 5777 Cedar Run Dr
- 5795 Cedar Run Dr
- 5767 Cedar Run Dr
- 5767 Cedar Run Dr
- 5805 Cedar Run Rd
- Lot 18 Cedar Run Dr
- 5778 Cedar Run Dr
- 5757 Cedar Run Dr
- 5757 Cedar Run Dr
- 5790 Cedar Run Dr
- 5790 Cedar Run Dr Unit 14
- 5778 Cedar Run Rd
- 5768 Cedar Run Dr
- 5790 Cedar Run Rd
- 5804 Cedar Run Dr
- 16 Cedar Run Dr Unit 16
- 5804 Cedar Run Dr
- 5749 Cedar Run Dr Unit 25
- 5749 Cedar Run Dr
- 5749 Cedar Run Dr
Your Personal Tour Guide
Ask me questions while you tour the home.