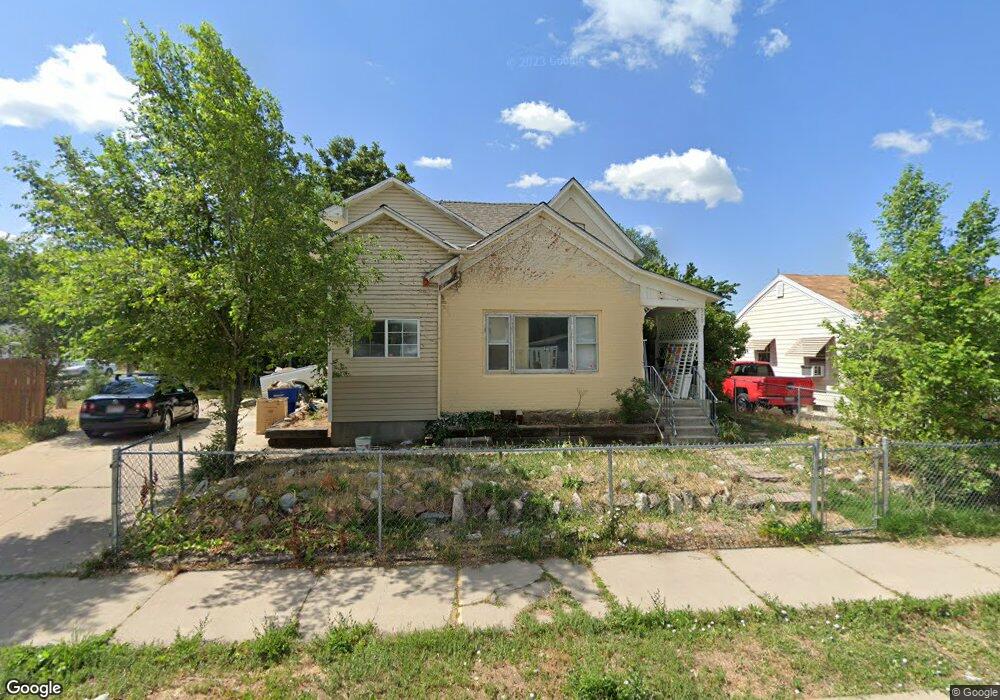
579 Cross St Ogden, UT 84404
Hillcrest-Bonneville NeighborhoodEstimated Value: $342,000 - $373,068
About This Home
This home is located at 579 Cross St, Ogden, UT 84404 and is currently estimated at $360,767, approximately $199 per square foot. 579 Cross St is a home located in Weber County with nearby schools including Bonneville School, Highland Junior High School, and Ben Lomond High School.
Ownership History
We collect this data history from publicly available records. To have your information removed, we recommend requesting removal directly through your county’s website.
Purchase Details
Home Financials for this Owner
Home Financials are based on the most recent Mortgage that was taken out on this home.Purchase Details
Purchase Details
Home Financials for this Owner
Home Financials are based on the most recent Mortgage that was taken out on this home.Purchase Details
Purchase Details
Purchase Details
Home Financials for this Owner
Home Financials are based on the most recent Mortgage that was taken out on this home.Purchase Details
Home Financials for this Owner
Home Financials are based on the most recent Mortgage that was taken out on this home.Purchase Details
Home Financials for this Owner
Home Financials are based on the most recent Mortgage that was taken out on this home.Purchase Details
Home Financials for this Owner
Home Financials are based on the most recent Mortgage that was taken out on this home.Purchase Details
Home Financials for this Owner
Home Financials are based on the most recent Mortgage that was taken out on this home.Home Values in the Area
Average Home Value in this Area
Purchase History
We collect this data history from publicly available records. To have your information removed, we recommend requesting removal directly through your county’s website.
| Date | Buyer | Sale Price | Title Company |
|---|---|---|---|
| -- | First American Title | ||
| -- | Old Republic Title | ||
| -- | Eagle Gate Title Insurance A | ||
| -- | First Southwestern Title Age | ||
| $78,625 | Inwest Title Services Salt L | ||
| -- | Atlas Title Salt Lake | ||
| -- | Mountain View Title | ||
| -- | First American Title | ||
| -- | -- | ||
| -- | -- |
Mortgage History
We collect this data history from publicly available records. To have your information removed, we recommend requesting removal directly through your county’s website.
| Date | Status | Borrower | Loan Amount |
|---|---|---|---|
| Open | $333,841 | ||
| Closed | $12,380 | ||
| Previous Owner | $89,548 | ||
| Previous Owner | $116,950 | ||
| Previous Owner | $100,000 | ||
| Previous Owner | $93,840 | ||
| Previous Owner | $83,028 | ||
| Previous Owner | $71,400 |
Tax History
We collect this data history from publicly available records. To have your information removed, we recommend requesting removal directly through your county’s website.
| Year | Tax Paid | Tax Assessment Tax Assessment Total Assessment is a certain percentage of the fair market value that is determined by local assessors to be the total taxable value of land and additions on the property. | Land | Improvement |
|---|---|---|---|---|
| 2025 | $2,411 | $194,438 | $58,697 | $135,741 |
| 2024 | $2,278 | $180,399 | $58,696 | $121,703 |
| 2023 | $1,725 | $297,000 | $95,879 | $201,121 |
| 2022 | $2,196 | $175,450 | $44,547 | $130,903 |
| 2021 | $1,742 | $231,000 | $50,967 | $180,033 |
| 2020 | $1,461 | $179,000 | $40,767 | $138,233 |
| 2019 | $1,478 | $170,000 | $30,793 | $139,207 |
| 2018 | $1,208 | $138,000 | $26,707 | $111,293 |
| 2017 | $1,031 | $110,000 | $26,707 | $83,293 |
| 2016 | $886 | $51,146 | $12,151 | $38,995 |
| 2015 | $895 | $50,365 | $12,151 | $38,214 |
| 2014 | $911 | $50,365 | $10,634 | $39,731 |
Map
- 1000 Adams Ave
- 708 9th St
- 712 9th St
- 1110 Jefferson Ave
- 1137 Liberty Ave
- 606 7th St
- 607 S Plum Creek Ln E Unit 34
- 615 S Plum Creek Ln E
- 598 Plum Creek Ln
- 854 Grant Ave
- 1156 Gramercy Ave
- 428 E 1025 S
- 449 13th St
- 876 E 1025 S Unit 49
- 317 E 750 S Unit 12
- 506 14th St
- 1124 S 865 E Unit 62
- 1424 Jefferson Ave
- 902 E 1140 S Unit 17
- 443 E 1415 S Unit 118
- 941 Jefferson Ave
- 575 Cross St
- 598 Cross St
- 945 Jefferson Ave
- 598 Cross St
- 930 Jefferson Ave
- 571 Cross St
- 952 S Jefferson Ave
- 955 Jefferson Ave
- 940 Jefferson Ave
- 582 Cross St
- 598 1/2 Cross St
- 946 Jefferson Ave
- 952 Jefferson Ave
- 615 Cross St
- 600 Cross St
- 566 Cross St
- 963 Jefferson Ave
- 567 Cross St
- 606 Cross St
Ask me questions while you tour the home.