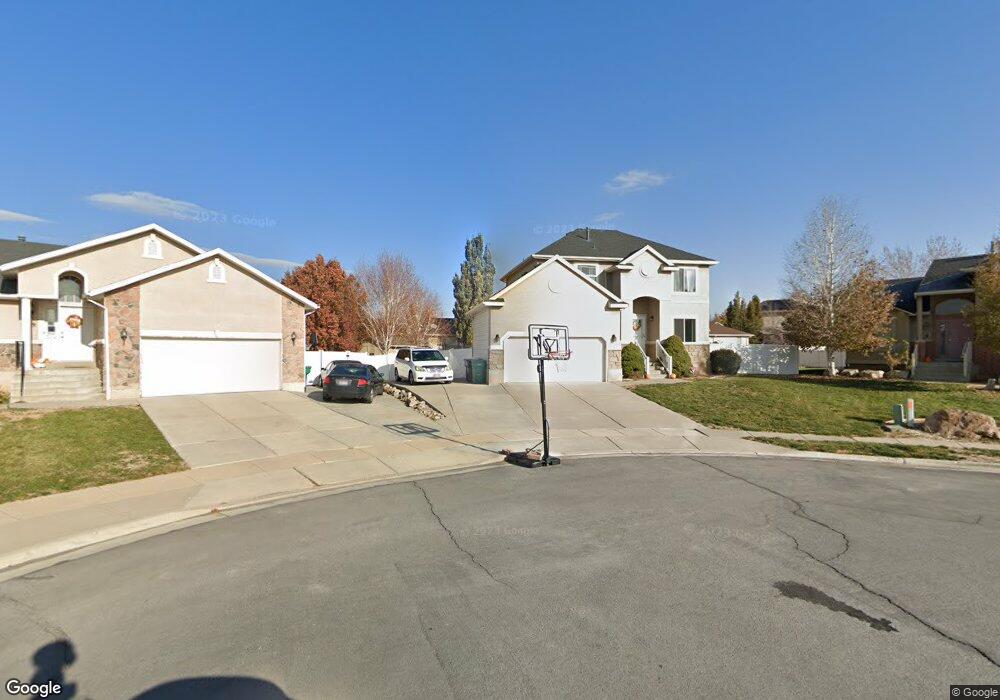
579 E 2200 S Clearfield, UT 84015
Estimated Value: $509,000 - $560,000
5
Beds
4
Baths
2,505
Sq Ft
$213/Sq Ft
Est. Value
About This Home
This home is located at 579 E 2200 S, Clearfield, UT 84015 and is currently estimated at $533,738, approximately $213 per square foot. 579 E 2200 S is a home located in Davis County with nearby schools including Antelope Elementary School, North Davis Junior High School, and Clearfield High School.
Ownership History
Date
Name
Owned For
Owner Type
Purchase Details
Closed on
Sep 16, 2019
Sold by
Forsling Steven J and Forsling Tracy
Bought by
Forsling Steven James and Forsling Tracy
Current Estimated Value
Home Financials for this Owner
Home Financials are based on the most recent Mortgage that was taken out on this home.
Original Mortgage
$267,750
Outstanding Balance
$234,014
Interest Rate
3.6%
Mortgage Type
New Conventional
Estimated Equity
$299,724
Purchase Details
Closed on
Apr 30, 2013
Sold by
Forsling Tracy
Bought by
Forsling Steven J and Forsling Tracy
Home Financials for this Owner
Home Financials are based on the most recent Mortgage that was taken out on this home.
Original Mortgage
$213,560
Interest Rate
3.5%
Mortgage Type
FHA
Purchase Details
Closed on
Jun 4, 2002
Sold by
Gmw Development Inc
Bought by
Sarazine Mike M and Sarazine Michele L
Home Financials for this Owner
Home Financials are based on the most recent Mortgage that was taken out on this home.
Original Mortgage
$165,305
Interest Rate
6.83%
Mortgage Type
FHA
Create a Home Valuation Report for This Property
The Home Valuation Report is an in-depth analysis detailing your home's value as well as a comparison with similar homes in the area
Home Values in the Area
Average Home Value in this Area
Purchase History
| Date | Buyer | Sale Price | Title Company |
|---|---|---|---|
| Forsling Steven James | -- | Guarantee Layton | |
| Forsling Steven J | -- | First American Title | |
| Forsling Tracy | -- | First American Title | |
| Sarazine Mike M | -- | Bonneville Title Company Inc |
Source: Public Records
Mortgage History
| Date | Status | Borrower | Loan Amount |
|---|---|---|---|
| Open | Forsling Steven James | $267,750 | |
| Closed | Forsling Tracy | $213,560 | |
| Previous Owner | Sarazine Mike M | $165,305 |
Source: Public Records
Tax History Compared to Growth
Tax History
| Year | Tax Paid | Tax Assessment Tax Assessment Total Assessment is a certain percentage of the fair market value that is determined by local assessors to be the total taxable value of land and additions on the property. | Land | Improvement |
|---|---|---|---|---|
| 2025 | $3,007 | $269,500 | $84,905 | $184,595 |
| 2024 | $2,900 | $261,800 | $81,104 | $180,696 |
| 2023 | $2,674 | $443,000 | $128,850 | $314,150 |
| 2022 | $2,903 | $260,150 | $69,424 | $190,726 |
| 2021 | $2,755 | $373,000 | $78,417 | $294,583 |
| 2020 | $2,395 | $322,000 | $66,833 | $255,167 |
| 2019 | $2,336 | $310,000 | $66,829 | $243,171 |
| 2018 | $2,188 | $283,000 | $59,318 | $223,682 |
| 2016 | $1,918 | $129,690 | $24,001 | $105,689 |
| 2015 | $1,884 | $121,440 | $24,001 | $97,439 |
| 2014 | $1,870 | $122,175 | $24,001 | $98,174 |
| 2013 | -- | $94,973 | $29,480 | $65,493 |
Source: Public Records
Map
Nearby Homes
- 2127 S 350 E
- 2438 W 1400 N
- 1477 N 2375 W
- 2114 S 825 E
- 2543 W 1275 N
- 1906 S 350 E
- 2912 W 1375 N
- 2828 Brady Way
- 1959 S 200 E
- 1250 N 2925 W
- 460 E 1700 S Unit 1 & 2
- 1430 N 2100 W
- 2631 W 1075 N
- 1071 Jamie-Matt Cir
- 2601 S 200 E
- 1491 N 1875 W
- 1491 N 1875 W Unit 158
- 1487 N 1875 W
- 1487 N 1875 W Unit 159
- 1483 N 1875 W