579 Foreman Rd Ardmore, OK 73401
Estimated Value: $78,027 - $225,000
2
Beds
1
Bath
1,132
Sq Ft
$147/Sq Ft
Est. Value
About This Home
This home is located at 579 Foreman Rd, Ardmore, OK 73401 and is currently estimated at $166,507, approximately $147 per square foot. 579 Foreman Rd is a home located in Carter County with nearby schools including Dickson Elementary School, Dickson Upper Elementary School, and Dickson Middle School.
Ownership History
Date
Name
Owned For
Owner Type
Purchase Details
Closed on
Jun 22, 2020
Sold by
Williamson Jason
Bought by
Williamson Amber
Current Estimated Value
Purchase Details
Closed on
Aug 22, 1995
Sold by
Williamson Keith
Bought by
Williamson Jason and Williamson Luc
Create a Home Valuation Report for This Property
The Home Valuation Report is an in-depth analysis detailing your home's value as well as a comparison with similar homes in the area
Home Values in the Area
Average Home Value in this Area
Purchase History
| Date | Buyer | Sale Price | Title Company |
|---|---|---|---|
| Williamson Amber | -- | None Available | |
| Williamson Jason | -- | -- |
Source: Public Records
Tax History Compared to Growth
Tax History
| Year | Tax Paid | Tax Assessment Tax Assessment Total Assessment is a certain percentage of the fair market value that is determined by local assessors to be the total taxable value of land and additions on the property. | Land | Improvement |
|---|---|---|---|---|
| 2025 | $455 | $4,628 | $1,023 | $3,605 |
| 2024 | $455 | $4,407 | $974 | $3,433 |
| 2023 | $434 | $4,198 | $918 | $3,280 |
| 2022 | $394 | $3,998 | $825 | $3,173 |
| 2021 | $385 | $3,808 | $300 | $3,508 |
| 2020 | $199 | $2,998 | $266 | $2,732 |
| 2019 | $184 | $2,910 | $263 | $2,647 |
| 2018 | $179 | $2,826 | $254 | $2,572 |
| 2017 | $174 | $2,744 | $252 | $2,492 |
| 2016 | $163 | $2,664 | $291 | $2,373 |
| 2015 | $156 | $2,586 | $242 | $2,344 |
| 2014 | $137 | $2,510 | $185 | $2,325 |
Source: Public Records
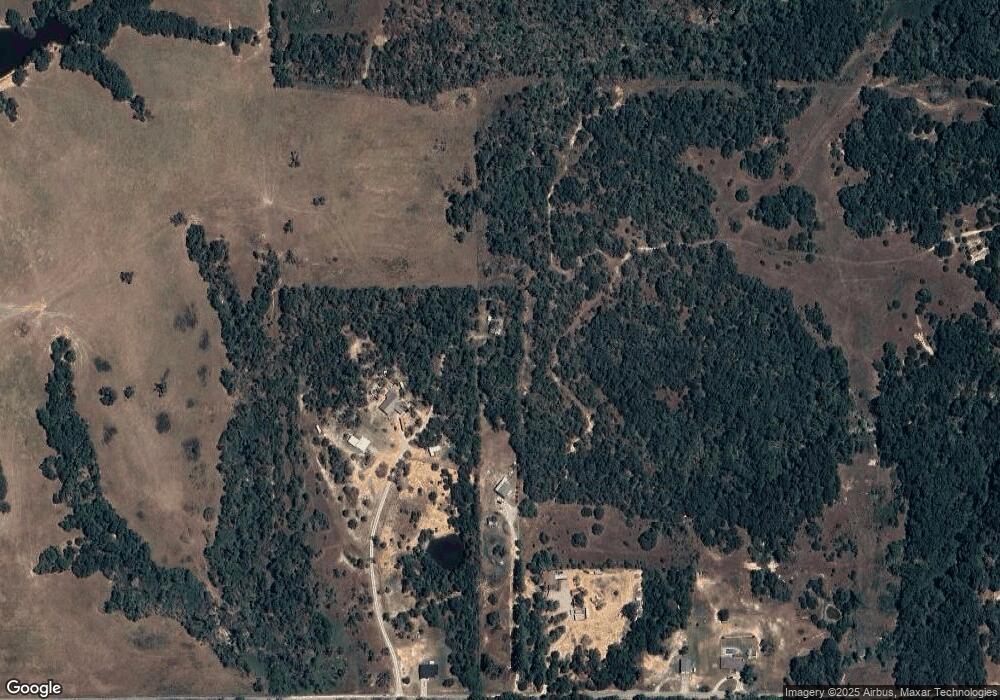
Map
Nearby Homes
- 0 Mockingbird Rd Unit 2541939
- 2048 Mockingbird Rd
- 546 Mockingbird Ln
- 95 Express Rd
- 1526 Sandy Creek Rd
- 006 Dickson Rd
- 124 Russet Dr
- 0 Timber Ridge Rd
- 6296 Dickson Rd
- 00 Ropers Rd
- 0 Mary Niblack Rd Unit 25102336
- 0 Mary Niblack Rd Unit 25102713
- 24243 Tiny Chapel Rd
- 17122 Sumac Rd
- 0003 Marlove Rd
- 0001 Marlove Rd
- N Pickens Rd
- 0002 Marlove Rd
- Tract 1 50AC N Pickens Rd
- 2807 Mcclain Rd
- 575 Foreman Rd
- 645 Foreman Rd
- 615 Foreman Rd
- 681 Foreman Rd
- 771 Foreman Rd
- 955 Foreman Rd
- 1101 Mockingbird Rd
- 939 Mockingbird Rd
- 1132 Hoxbar Rd
- 1632 Hoxbar Rd
- 1225 Hoxbar Rd
- 1329 Hoxbar Rd
- 3418 Us Highway 70
- 2209 Mockingbird Rd
- 0 Mockingbird Rd Unit 2435713
- 0 Mockingbird Rd Unit 1106561
- 0 Mockingbird Rd Unit 1078606
- 0 Mockingbird Rd Unit 2330788
- 2335 Mockingbird Rd
- 0 Mockingbird Rd