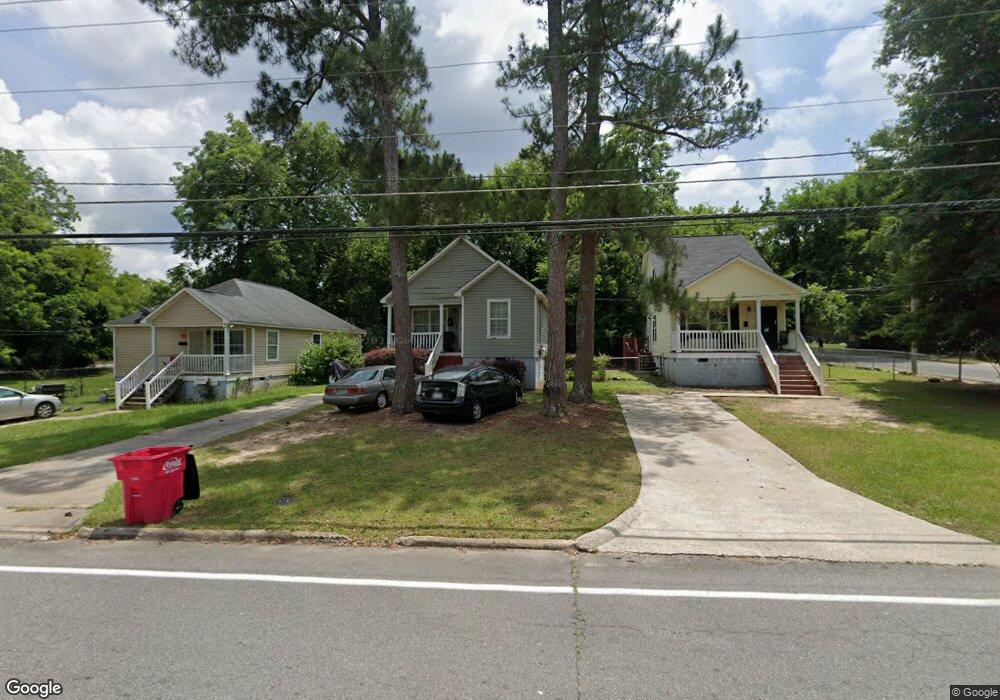
579 Hall St Macon, GA 31217
Fort Hill Historic District NeighborhoodEstimated Value: $73,000 - $134,000
3
Beds
2
Baths
1,102
Sq Ft
$95/Sq Ft
Est. Value
About This Home
This home is located at 579 Hall St, Macon, GA 31217 and is currently estimated at $104,208, approximately $94 per square foot. 579 Hall St is a home located in Bibb County with nearby schools including Burdell Elementary School, Appling Middle School, and Northeast High School.
Ownership History
Date
Name
Owned For
Owner Type
Purchase Details
Closed on
Mar 15, 2013
Sold by
Dennis Lashunda D and Walker Lashunda D
Bought by
Walker Lashunda D and Walker Ramone
Current Estimated Value
Home Financials for this Owner
Home Financials are based on the most recent Mortgage that was taken out on this home.
Original Mortgage
$55,205
Outstanding Balance
$40,676
Interest Rate
4.62%
Mortgage Type
FHA
Estimated Equity
$63,532
Purchase Details
Closed on
Nov 6, 2008
Sold by
Whitby Inc
Bought by
Dennis Lashunda D
Home Financials for this Owner
Home Financials are based on the most recent Mortgage that was taken out on this home.
Original Mortgage
$59,829
Interest Rate
5.89%
Mortgage Type
FHA
Purchase Details
Closed on
Feb 14, 2005
Bought by
Whitby Inc
Purchase Details
Closed on
Sep 29, 2004
Create a Home Valuation Report for This Property
The Home Valuation Report is an in-depth analysis detailing your home's value as well as a comparison with similar homes in the area
Home Values in the Area
Average Home Value in this Area
Purchase History
| Date | Buyer | Sale Price | Title Company |
|---|---|---|---|
| Walker Lashunda D | -- | None Available | |
| Dennis Lashunda D | -- | None Available | |
| City Of Macons Economic & Community Deve | $85,000 | None Available | |
| Whitby Inc | $13,500 | -- | |
| -- | -- | -- |
Source: Public Records
Mortgage History
| Date | Status | Borrower | Loan Amount |
|---|---|---|---|
| Open | Walker Lashunda D | $55,205 | |
| Previous Owner | City Of Macons Economic & Community Deve | $59,829 |
Source: Public Records
Tax History Compared to Growth
Tax History
| Year | Tax Paid | Tax Assessment Tax Assessment Total Assessment is a certain percentage of the fair market value that is determined by local assessors to be the total taxable value of land and additions on the property. | Land | Improvement |
|---|---|---|---|---|
| 2025 | $771 | $38,375 | $1,980 | $36,395 |
| 2024 | $682 | $33,836 | $1,080 | $32,756 |
| 2023 | $220 | $33,656 | $900 | $32,756 |
| 2022 | $535 | $22,448 | $1,457 | $20,991 |
| 2021 | $325 | $15,540 | $546 | $14,994 |
| 2020 | $273 | $14,040 | $546 | $13,494 |
| 2019 | $217 | $12,541 | $546 | $11,995 |
| 2018 | $512 | $12,541 | $546 | $11,995 |
| 2017 | $208 | $12,541 | $546 | $11,995 |
| 2016 | $192 | $12,541 | $546 | $11,995 |
| 2015 | $272 | $12,541 | $546 | $11,995 |
| 2014 | $535 | $15,576 | $583 | $14,994 |
Source: Public Records
Map
Nearby Homes
- 658 Pringle St
- 842 Little Short St
- 734 Fort Hill St
- 970 Center St
- 990 Center St
- 390 Cowan St
- 348 Woolfolk St
- 760 Cowan St
- 378 Cowan St
- 738 Hall St
- 727 Smith St
- 768 Maynard St
- 774 Maynard St
- 722 Mitchell St
- 751 Mitchell St
- 363 Woolfolk St Unit 361 Woolfolk Street
- 363 AND 361 Woolfolk St
- 735 Maynard St
- 1059 Fort Hill St
- 857 Mitchell St