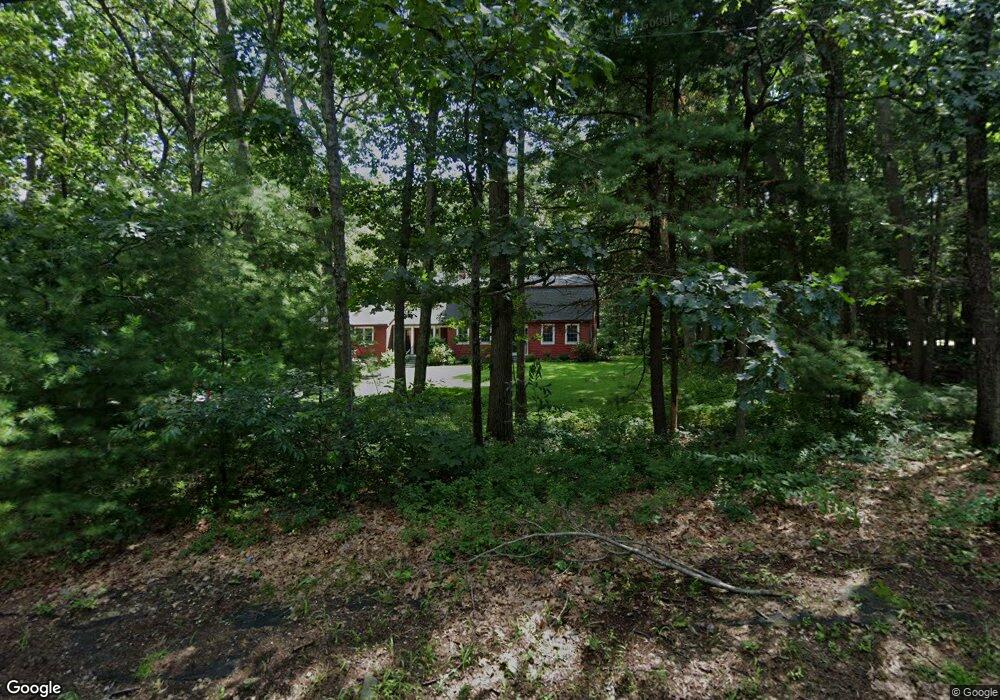
579 Hemenway St Marlborough, MA 01752
Estimated Value: $880,487 - $1,043,000
3
Beds
4
Baths
3,168
Sq Ft
$298/Sq Ft
Est. Value
About This Home
This home is located at 579 Hemenway St, Marlborough, MA 01752 and is currently estimated at $942,872, approximately $297 per square foot. 579 Hemenway St is a home located in Middlesex County with nearby schools including Marlborough High School, New Covenant Christian School, and Glenhaven Academy - JRI School.
Ownership History
Date
Name
Owned For
Owner Type
Purchase Details
Closed on
Feb 12, 2007
Sold by
Morin Linda G
Bought by
Mossman John J and Morin Linda G
Current Estimated Value
Home Financials for this Owner
Home Financials are based on the most recent Mortgage that was taken out on this home.
Original Mortgage
$210,000
Outstanding Balance
$126,200
Interest Rate
6.22%
Mortgage Type
Purchase Money Mortgage
Estimated Equity
$816,672
Create a Home Valuation Report for This Property
The Home Valuation Report is an in-depth analysis detailing your home's value as well as a comparison with similar homes in the area
Home Values in the Area
Average Home Value in this Area
Purchase History
| Date | Buyer | Sale Price | Title Company |
|---|---|---|---|
| Mossman John J | -- | -- |
Source: Public Records
Mortgage History
| Date | Status | Borrower | Loan Amount |
|---|---|---|---|
| Open | Mossman John J | $210,000 |
Source: Public Records
Tax History Compared to Growth
Tax History
| Year | Tax Paid | Tax Assessment Tax Assessment Total Assessment is a certain percentage of the fair market value that is determined by local assessors to be the total taxable value of land and additions on the property. | Land | Improvement |
|---|---|---|---|---|
| 2025 | $8,104 | $821,900 | $231,200 | $590,700 |
| 2024 | $7,842 | $765,800 | $210,300 | $555,500 |
| 2023 | $8,015 | $694,500 | $181,700 | $512,800 |
| 2022 | $7,705 | $587,300 | $173,000 | $414,300 |
| 2021 | $6,627 | $556,800 | $144,300 | $412,500 |
| 2020 | $7,545 | $532,100 | $137,400 | $394,700 |
| 2019 | $6,945 | $493,600 | $134,700 | $358,900 |
| 2018 | $6,962 | $474,400 | $118,000 | $356,400 |
| 2017 | $7,056 | $460,600 | $117,700 | $342,900 |
| 2016 | $6,954 | $453,300 | $117,700 | $335,600 |
| 2015 | $7,100 | $450,500 | $120,900 | $329,600 |
Source: Public Records
Map
Nearby Homes
- 168 Blanchette Dr
- 618 Sudbury St
- 551 Sudbury St
- 17 Mcneil Cir
- 28 Stetson Dr
- 3 Stonehill Rd
- 38 Collins Dr
- 16 Minehan Ln
- 114 Linda Cir
- 492 Stow Rd
- 688 Boston Post Rd E Unit 202
- 688 Boston Post Rd E Unit 304
- 688 Boston Post Rd E Unit 100
- 688 Boston Post Rd E Unit 324
- 688 Boston Post Rd E Unit 228
- 274 Naugler Ave
- 624 Boston Post Rd E Unit 7
- 608 Boston Post Rd E Unit 11
- 596 Boston Post Rd E Unit 13
- 596 Boston Post Rd E