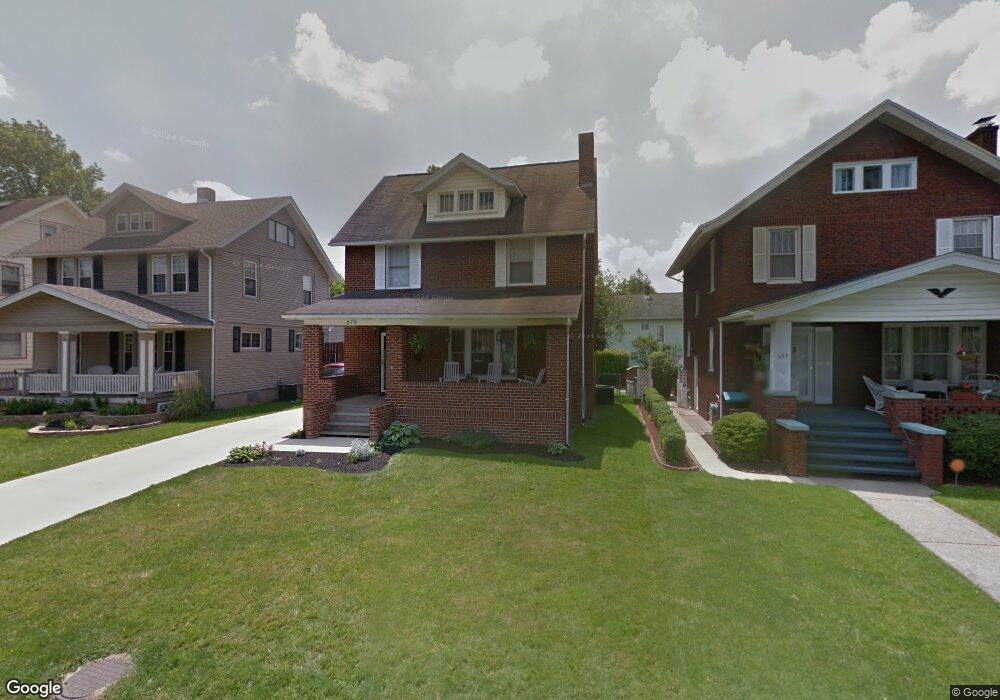
579 Maple St Mansfield, OH 44906
Estimated Value: $135,000 - $164,000
4
Beds
1
Bath
1,456
Sq Ft
$103/Sq Ft
Est. Value
About This Home
This home is located at 579 Maple St, Mansfield, OH 44906 and is currently estimated at $150,189, approximately $103 per square foot. 579 Maple St is a home located in Richland County with nearby schools including Goal Digital Academy, Discovery School, and St. Peter's Junior High / High School.
Ownership History
Date
Name
Owned For
Owner Type
Purchase Details
Closed on
Apr 29, 2003
Sold by
Siegel Perry M and Siegel Heather M
Bought by
Spearman Thomas L and Spearman Julie E
Current Estimated Value
Home Financials for this Owner
Home Financials are based on the most recent Mortgage that was taken out on this home.
Original Mortgage
$81,100
Outstanding Balance
$35,427
Interest Rate
5.86%
Mortgage Type
Purchase Money Mortgage
Estimated Equity
$114,762
Purchase Details
Closed on
Dec 19, 2000
Sold by
Bolte Mary B
Bought by
Siegel Perry M and Siegel Heather M
Home Financials for this Owner
Home Financials are based on the most recent Mortgage that was taken out on this home.
Original Mortgage
$78,400
Interest Rate
7.8%
Mortgage Type
FHA
Purchase Details
Closed on
Jun 24, 1993
Sold by
Boyd Ella
Bought by
Bolte Mary B
Create a Home Valuation Report for This Property
The Home Valuation Report is an in-depth analysis detailing your home's value as well as a comparison with similar homes in the area
Home Values in the Area
Average Home Value in this Area
Purchase History
| Date | Buyer | Sale Price | Title Company |
|---|---|---|---|
| Spearman Thomas L | $81,000 | Ltic | |
| Siegel Perry M | $78,500 | -- | |
| Bolte Mary B | -- | -- |
Source: Public Records
Mortgage History
| Date | Status | Borrower | Loan Amount |
|---|---|---|---|
| Open | Spearman Thomas L | $81,100 | |
| Previous Owner | Siegel Perry M | $78,400 |
Source: Public Records
Tax History
| Year | Tax Paid | Tax Assessment Tax Assessment Total Assessment is a certain percentage of the fair market value that is determined by local assessors to be the total taxable value of land and additions on the property. | Land | Improvement |
|---|---|---|---|---|
| 2024 | $1,875 | $39,150 | $3,300 | $35,850 |
| 2023 | $1,874 | $39,150 | $3,300 | $35,850 |
| 2022 | $1,549 | $27,120 | $2,840 | $24,280 |
| 2021 | $1,560 | $27,120 | $2,840 | $24,280 |
| 2020 | $1,596 | $27,120 | $2,840 | $24,280 |
| 2019 | $1,769 | $27,120 | $2,840 | $24,280 |
| 2018 | $1,745 | $27,120 | $2,840 | $24,280 |
| 2017 | $1,721 | $27,120 | $2,840 | $24,280 |
| 2016 | $1,744 | $27,010 | $3,910 | $23,100 |
| 2015 | $1,666 | $27,010 | $3,910 | $23,100 |
| 2014 | $1,644 | $27,010 | $3,910 | $23,100 |
| 2012 | $663 | $28,420 | $4,110 | $24,310 |
Source: Public Records
Map
Nearby Homes
- 189 Westwood Ave
- 190 Dawson Ave
- 116 Stewart Ave S
- 126 Dawson Ave
- 108 Stewart Ave S
- 169 Euclid Ave
- 71 Dawson Ave
- 455 Marion Ave
- 31 Parkwood Blvd
- 679 Coleman Rd
- 143 Fairlawn Ave
- 135 Fairlawn Ave
- 129 Fairlawn Ave
- 686 Barnard Ave
- 30 Douglas Ave
- 51 Lind Ave
- 616 Cline Ave
- 38 Penn Ave
- 183 Carpenter Rd
- 458 W West Dickson Ave
- 583 Maple St
- 575 Maple St
- 571 Maple St
- 171 Westwood Ave
- 171 Westwood Ave
- 593 Maple St
- 593 Maple St Unit Lower Unit
- 567 Maple St
- 148 Stewart Ave S
- 179 Westwood Ave
- 170 Westwood Ave
- 146 Stewart Ave S
- 595 Maple St
- 563 Maple St
- 149 Glenwood Blvd
- 178 Westwood Ave
- 151 Stewart Ave S
- 142 Stewart Ave S
- 191 Westwood Ave
- 141 Glenwood Blvd Unit 143
Your Personal Tour Guide
Ask me questions while you tour the home.