579 N Apache Ln West Wendover, NV 89883
Estimated Value: $204,000 - $289,000
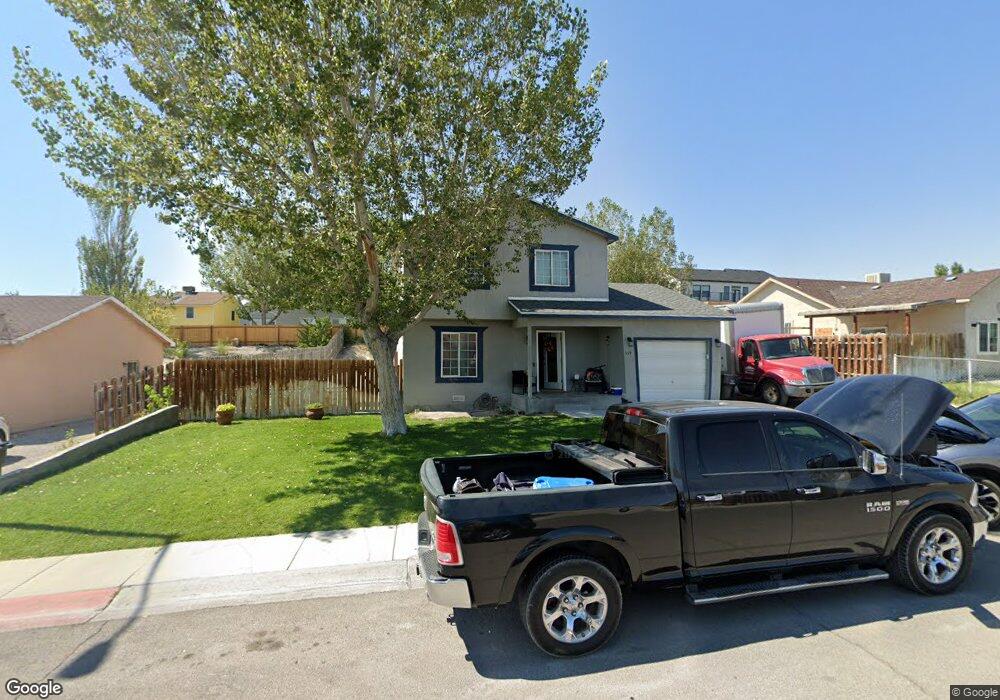
About This Home
This home is located at 579 N Apache Ln, West Wendover, NV 89883 and is currently estimated at $255,570, approximately $218 per square foot. 579 N Apache Ln is a home with nearby schools including West Wendover Elementary School, West Wendover Junior High School, and West Wendover High School.
Ownership History
We collect this data history from publicly available records. To have your information removed, we recommend requesting removal directly through your county’s website.
Purchase Details
Home Financials for this Owner
Home Financials are based on the most recent Mortgage that was taken out on this home.Purchase Details
Purchase Details
Home Financials for this Owner
Home Financials are based on the most recent Mortgage that was taken out on this home.Purchase Details
Purchase Details
Home Values in the Area
Average Home Value in this Area
Purchase History
We collect this data history from publicly available records. To have your information removed, we recommend requesting removal directly through your county’s website.
| Date | Buyer | Sale Price | Title Company |
|---|---|---|---|
| $108,500 | First American Title Pase | ||
| $108,800 | Accommodation | ||
| $129,000 | First American Title Elko | ||
| $70,000 | First American Title | ||
| -- | First American Title |
Mortgage History
We collect this data history from publicly available records. To have your information removed, we recommend requesting removal directly through your county’s website.
| Date | Status | Borrower | Loan Amount |
|---|---|---|---|
| Open | $106,534 | ||
| Previous Owner | $131,632 |
Tax History
We collect this data history from publicly available records. To have your information removed, we recommend requesting removal directly through your county’s website.
| Year | Tax Paid | Tax Assessment Tax Assessment Total Assessment is a certain percentage of the fair market value that is determined by local assessors to be the total taxable value of land and additions on the property. | Land | Improvement |
|---|---|---|---|---|
| 2025 | $1,858 | $49,427 | $9,450 | $39,977 |
| 2024 | $1,858 | $50,441 | $9,450 | $40,991 |
| 2023 | $1,710 | $47,938 | $9,450 | $38,488 |
| 2022 | $1,657 | $42,337 | $9,450 | $32,887 |
| 2021 | $1,638 | $41,236 | $9,450 | $31,786 |
| 2020 | $1,645 | $42,124 | $9,450 | $32,674 |
| 2019 | $1,600 | $40,203 | $9,450 | $30,753 |
| 2018 | $1,608 | $40,419 | $9,450 | $30,969 |
| 2017 | $1,596 | $40,073 | $9,450 | $30,623 |
| 2016 | $1,565 | $37,075 | $9,450 | $27,625 |
| 2015 | $1,424 | $36,782 | $9,450 | $27,332 |
| 2014 | $1,386 | $35,636 | $9,450 | $26,186 |
Map
- 1904 W Canyon St
- 901 Alpine St
- 0 Pueblo Blvd Unit 3627257
- 0 Pueblo Blvd Unit 11071957
- 0 Pueblo Blvd Unit 25262568
- 871 Blue Grass Cir
- 867 Blue Grass Cir
- 861 Blue Grass Cir
- 2000 Blue Grass Cir
- 863 Blue Grass Cir
- 2101 Blue Grass Cir
- 879 Blue Grass Cir
- 2103 Blue Grass Cir
- 875 Blue Grass Cir
- 2102 Blue Grass Cir
- 0 N Butte St
- 1890 Pueblo Blvd
- 0 Butte St Unit 3627062
- 0 Sec 17 Twp 33n Rge 70e Mdb&m Unit 3627164
- 2928 Fairway View Dr
- 595 N Apache Ln
- 569 N Apache Ln
- 570 N Apache Ln
- 588 N Tibbets Blvd
- 619 N Apache Ln
- 535 N Apache Ln
- 598 N Tibbets Blvd
- 554 N Apache Ln
- 2095 W Shawnee Cir
- 566 N Tibbets Blvd
- 612 N Tibbets Blvd
- 532 N Apache Ln
- 639 N Apache Ln
- 525 N Apache Ln
- 2075 W Shawnee Cir
- 544 N Tibbets Blvd
- 2086 W Shawnee Cir
- 647 N Apache Ln
- 2014 W Canyon St
- 520 N Apache Ln
Ask me questions while you tour the home.