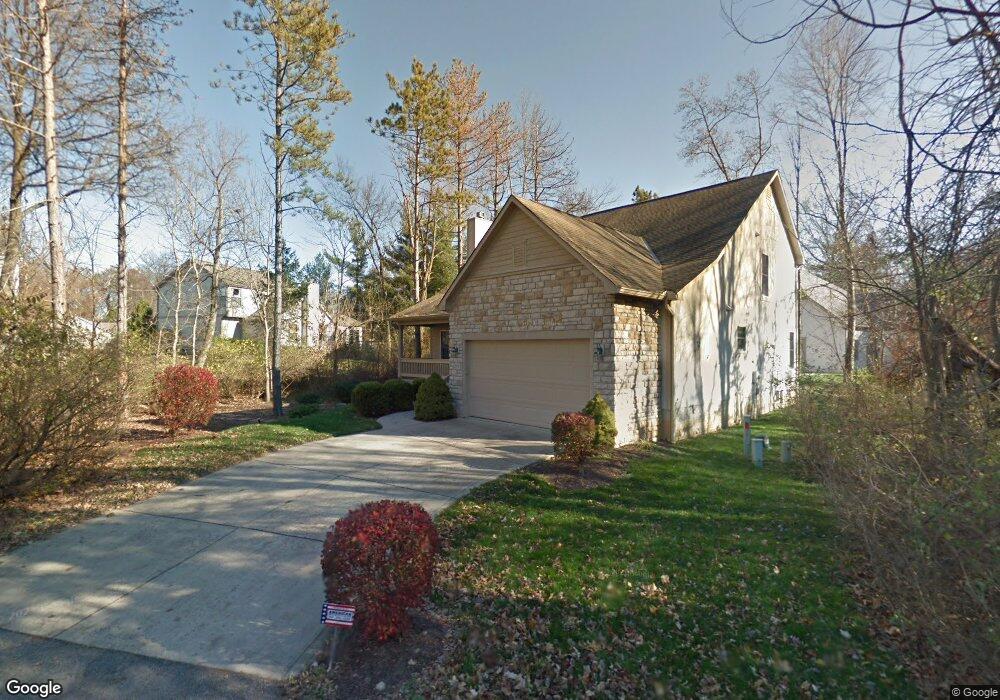
579 Pinegrove Place Columbus, OH 43230
Estimated Value: $416,000 - $475,000
3
Beds
3
Baths
1,748
Sq Ft
$254/Sq Ft
Est. Value
About This Home
This home is located at 579 Pinegrove Place, Columbus, OH 43230 and is currently estimated at $444,783, approximately $254 per square foot. 579 Pinegrove Place is a home located in Franklin County with nearby schools including Chapelfield Elementary School, Gahanna West Middle School, and Lincoln High School.
Ownership History
Date
Name
Owned For
Owner Type
Purchase Details
Closed on
May 14, 2003
Sold by
Keller Robert T and Keller Miriam W
Bought by
Keller Robert T and Keller Miriam W
Current Estimated Value
Purchase Details
Closed on
Jun 24, 2002
Sold by
Brand Homes Llc
Bought by
Keller Robert T and Keller Miriam W
Home Financials for this Owner
Home Financials are based on the most recent Mortgage that was taken out on this home.
Original Mortgage
$75,000
Interest Rate
4.99%
Purchase Details
Closed on
Aug 30, 2000
Sold by
Ridenour Road Development Co
Bought by
Burgan Roy E and Burgan Susan R
Home Financials for this Owner
Home Financials are based on the most recent Mortgage that was taken out on this home.
Original Mortgage
$39,200
Interest Rate
10.5%
Purchase Details
Closed on
Jan 3, 1994
Create a Home Valuation Report for This Property
The Home Valuation Report is an in-depth analysis detailing your home's value as well as a comparison with similar homes in the area
Home Values in the Area
Average Home Value in this Area
Purchase History
| Date | Buyer | Sale Price | Title Company |
|---|---|---|---|
| Keller Robert T | -- | -- | |
| Keller Robert T | $180,000 | Stewart Title Agency Of Colu | |
| Burgan Roy E | $49,000 | Allodial Title Company | |
| -- | -- | -- |
Source: Public Records
Mortgage History
| Date | Status | Borrower | Loan Amount |
|---|---|---|---|
| Previous Owner | Keller Robert T | $75,000 | |
| Previous Owner | Burgan Roy E | $39,200 |
Source: Public Records
Tax History Compared to Growth
Tax History
| Year | Tax Paid | Tax Assessment Tax Assessment Total Assessment is a certain percentage of the fair market value that is determined by local assessors to be the total taxable value of land and additions on the property. | Land | Improvement |
|---|---|---|---|---|
| 2024 | $7,285 | $133,460 | $40,950 | $92,510 |
| 2023 | $7,230 | $133,455 | $40,950 | $92,505 |
| 2022 | $7,057 | $103,250 | $21,000 | $82,250 |
| 2021 | $6,825 | $103,250 | $21,000 | $82,250 |
| 2020 | $6,768 | $103,250 | $21,000 | $82,250 |
| 2019 | $5,552 | $86,100 | $17,500 | $68,600 |
| 2018 | $5,281 | $86,100 | $17,500 | $68,600 |
| 2017 | $5,070 | $86,100 | $17,500 | $68,600 |
| 2016 | $5,046 | $78,510 | $17,470 | $61,040 |
| 2015 | $5,050 | $78,510 | $17,470 | $61,040 |
| 2014 | $5,011 | $78,510 | $17,470 | $61,040 |
| 2013 | $2,488 | $78,505 | $17,465 | $61,040 |
Source: Public Records
Map
Nearby Homes
- 642 Ridenour Rd
- 364 Morgan Ln
- 760 Old Forest Ct
- 175 Stonegate Cir
- 3610 N Stygler Rd
- 536 Springwood Lake Dr
- 404 Foxwood Dr
- 108 Walcreek Dr W
- 583 Shadewood Ct
- 832 Humboldt Dr E
- 243 Camrose Ct
- 804 Cherry Bottom Rd
- 343 Imperial Dr
- 920 Peppercorn Place
- 944 Irvington Place
- 3877 Hines Rd
- 668 Kenilworth Ct
- 3150 Berkley Pointe Dr
- 3481 Halpern St
- 209 Springbrook Place
- 624 Ridenour Rd
- 653 Founders Ridge Dr
- 618 Ridenour Rd
- 645 Founders Ridge Dr
- 632 Ridenour Rd
- 582 Pinegrove Place
- 583 Pinegrove Place
- 34 Founders Ridge Dr
- 37 Founders Ridge Dr
- 57 Founders Ridge Dr Unit L-57
- 57 Founders Ridge Dr
- 0 Founders Ridge Dr Unit L 37 9702211
- 27 Founders Ridge Dr
- 33 Founders Ridge Dr
- 0 Founders Ridge Dr Unit L-57
- 639 Founders Ridge Dr
- 586 Pinegrove Place
- 576 Pinegrove Place
- 665 Founders Ridge Dr
- 665 Founders Ridge Dr Unit 34