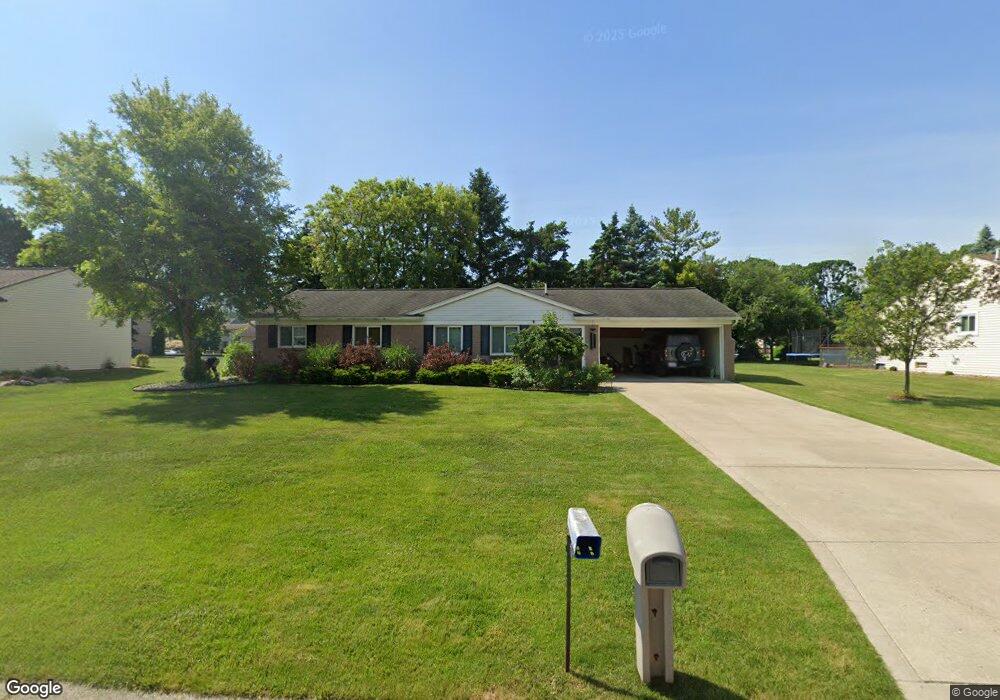
579 Ridge Rd Walled Lake, MI 48390
Estimated Value: $293,000 - $356,000
3
Beds
2
Baths
1,379
Sq Ft
$228/Sq Ft
Est. Value
About This Home
This home is located at 579 Ridge Rd, Walled Lake, MI 48390 and is currently estimated at $314,416, approximately $228 per square foot. 579 Ridge Rd is a home located in Oakland County with nearby schools including Walled Lake Elementary School, Sarah G. Banks Middle School, and Walled Lake Western High School.
Ownership History
Date
Name
Owned For
Owner Type
Purchase Details
Closed on
Oct 28, 2011
Sold by
Lublin Sheldon B and Lublin Phyllis E
Bought by
Howard Carl and Howard Marcie
Current Estimated Value
Home Financials for this Owner
Home Financials are based on the most recent Mortgage that was taken out on this home.
Original Mortgage
$95,200
Outstanding Balance
$9,628
Interest Rate
4.02%
Mortgage Type
New Conventional
Estimated Equity
$304,788
Purchase Details
Closed on
Oct 19, 2011
Sold by
Lublin Sheldon E and Lublin Phyllis E
Bought by
Howard Marcie A and Lublin Marcie A
Home Financials for this Owner
Home Financials are based on the most recent Mortgage that was taken out on this home.
Original Mortgage
$95,200
Outstanding Balance
$9,628
Interest Rate
4.02%
Mortgage Type
New Conventional
Estimated Equity
$304,788
Purchase Details
Closed on
Dec 18, 2000
Sold by
Luscomb Raymond W
Bought by
Lublin Sheldon B
Home Financials for this Owner
Home Financials are based on the most recent Mortgage that was taken out on this home.
Original Mortgage
$115,000
Interest Rate
7.58%
Create a Home Valuation Report for This Property
The Home Valuation Report is an in-depth analysis detailing your home's value as well as a comparison with similar homes in the area
Home Values in the Area
Average Home Value in this Area
Purchase History
| Date | Buyer | Sale Price | Title Company |
|---|---|---|---|
| Howard Carl | -- | None Available | |
| Howard Marcie A | -- | None Available | |
| Lublin Sheldon B | $150,000 | -- |
Source: Public Records
Mortgage History
| Date | Status | Borrower | Loan Amount |
|---|---|---|---|
| Open | Howard Carl | $95,200 | |
| Previous Owner | Lublin Sheldon B | $115,000 |
Source: Public Records
Tax History Compared to Growth
Tax History
| Year | Tax Paid | Tax Assessment Tax Assessment Total Assessment is a certain percentage of the fair market value that is determined by local assessors to be the total taxable value of land and additions on the property. | Land | Improvement |
|---|---|---|---|---|
| 2024 | $3,085 | $134,050 | $0 | $0 |
| 2023 | $2,908 | $124,070 | $0 | $0 |
| 2022 | $2,900 | $111,170 | $0 | $0 |
| 2021 | $2,939 | $107,640 | $0 | $0 |
| 2020 | $2,803 | $101,240 | $0 | $0 |
| 2019 | $2,894 | $93,300 | $0 | $0 |
| 2018 | $2,884 | $90,420 | $0 | $0 |
| 2017 | $2,857 | $90,520 | $0 | $0 |
| 2016 | $2,902 | $76,430 | $0 | $0 |
| 2015 | -- | $70,480 | $0 | $0 |
| 2014 | -- | $66,490 | $0 | $0 |
| 2011 | -- | $60,330 | $0 | $0 |
Source: Public Records
Map
Nearby Homes
- 3101 Cameron Cir
- 29204 April Ct Unit 236
- 8204 Alexa Dr Unit 88
- 17102 Caitlin Cir Unit 147
- 30204 Chantel Dr Unit 228
- 18203 Adri Cir Unit 122
- 34202 Emma Cir
- 1130 Sigma Rd
- 1805 Hawthorne Ridge
- 451 Gamma Rd
- 454 Old Pine Way Unit 154
- 1493 Mariner Dr
- 470 Old Pine Way Unit 162
- 145 E Bay Dr Unit 35
- 135 E Bay Dr Unit 20
- 449 Village Dr Unit 181
- 157 E Bay Dr
- 439 Village Dr Unit 184
- 414 Old Pine Way Unit 136
- 446 Boardwalk Dr Unit 89
- 571 Ridge Rd
- 591 Ridge Rd
- 1569 Oak Grove Dr
- 1563 Oak Grove Dr
- 1575 Oak Grove Dr
- 578 Ridge Rd
- 559 Ridge Rd
- 599 Ridge Rd
- 590 Ridge Rd
- 570 Ridge Rd
- 1581 Oak Grove Dr
- 1557 Oak Grove Dr
- 612 Ridge Rd
- 600 Pine Tree Ct
- 1570 Oak Grove Dr
- 1619 Oak Grove Dr
- 1564 Oak Grove Dr
- 1576 Oak Grove Dr
- 1595 Oak Grove Dr
- 611 Ridge Rd