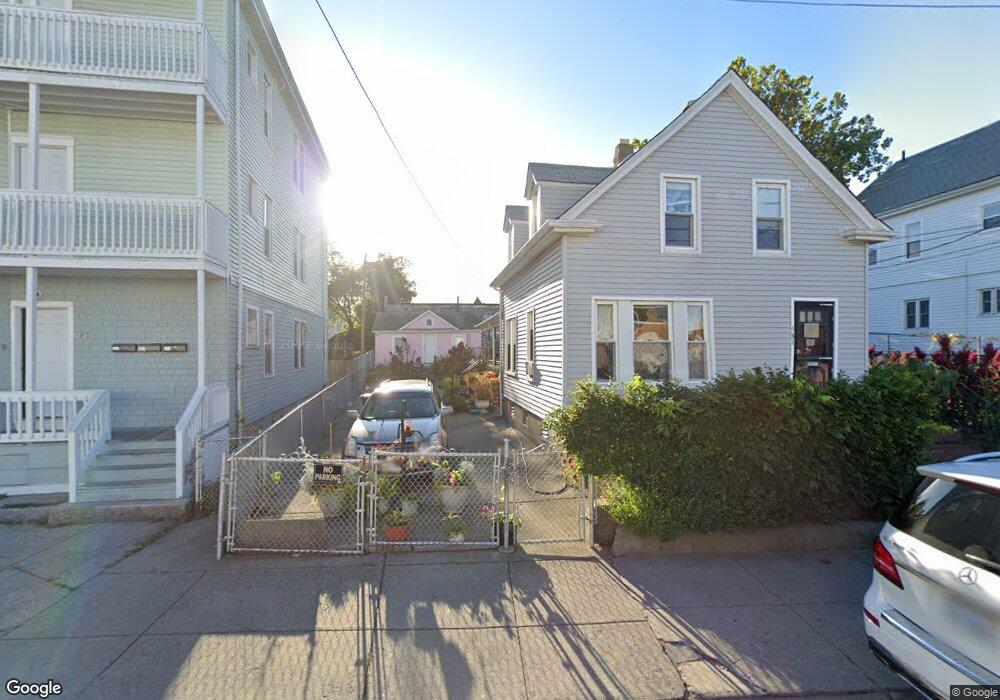
579 S 2nd St New Bedford, MA 02744
The South End NeighborhoodEstimated Value: $230,166
2
Beds
2
Baths
4,710
Sq Ft
$49/Sq Ft
Est. Value
About This Home
This home is located at 579 S 2nd St, New Bedford, MA 02744 and is currently estimated at $230,166, approximately $48 per square foot. 579 S 2nd St is a home located in Bristol County with nearby schools including Renaissance Community Innovation School, Alfred J. Gomes Elementary School, and Roosevelt Middle School.
Ownership History
Date
Name
Owned For
Owner Type
Purchase Details
Closed on
May 29, 2008
Sold by
Waterview T and Osborn John D
Bought by
Tfr Corp and Tfs Corp
Current Estimated Value
Home Financials for this Owner
Home Financials are based on the most recent Mortgage that was taken out on this home.
Original Mortgage
$93,500
Outstanding Balance
$59,568
Interest Rate
5.91%
Mortgage Type
Commercial
Estimated Equity
$170,598
Purchase Details
Closed on
Apr 25, 1989
Sold by
Decker Rt
Bought by
Osborn Frederic C
Home Financials for this Owner
Home Financials are based on the most recent Mortgage that was taken out on this home.
Original Mortgage
$66,400
Interest Rate
10.79%
Mortgage Type
Commercial
Create a Home Valuation Report for This Property
The Home Valuation Report is an in-depth analysis detailing your home's value as well as a comparison with similar homes in the area
Home Values in the Area
Average Home Value in this Area
Purchase History
| Date | Buyer | Sale Price | Title Company |
|---|---|---|---|
| Tfr Corp | $110,000 | -- | |
| Tfr Corp | $110,000 | -- | |
| Osborn Frederic C | $83,000 | -- | |
| Osborn Frederic C | $83,000 | -- |
Source: Public Records
Mortgage History
| Date | Status | Borrower | Loan Amount |
|---|---|---|---|
| Open | Osborn Frederic C | $93,500 | |
| Closed | Osborn Frederic C | $93,500 | |
| Previous Owner | Osborn Frederic C | $75,000 | |
| Previous Owner | Osborn Frederic C | $66,400 |
Source: Public Records
Tax History Compared to Growth
Tax History
| Year | Tax Paid | Tax Assessment Tax Assessment Total Assessment is a certain percentage of the fair market value that is determined by local assessors to be the total taxable value of land and additions on the property. | Land | Improvement |
|---|---|---|---|---|
| 2025 | -- | $208,300 | $138,600 | $69,700 |
| 2024 | -- | $218,700 | $128,900 | $89,800 |
| 2023 | $0 | $186,600 | $107,400 | $79,200 |
| 2022 | $0 | $165,600 | $101,900 | $63,700 |
| 2021 | $3,818 | $149,100 | $97,000 | $52,100 |
| 2020 | $0 | $145,500 | $97,000 | $48,500 |
| 2019 | $0 | $147,600 | $97,000 | $50,600 |
| 2018 | $3,440 | $141,300 | $93,500 | $47,800 |
| 2017 | -- | $141,300 | $93,500 | $47,800 |
| 2016 | -- | $142,100 | $93,500 | $48,600 |
| 2015 | -- | $145,600 | $97,000 | $48,600 |
| 2014 | -- | $148,100 | $97,000 | $51,100 |
Source: Public Records
Map
Nearby Homes
- 68 County St
- 581 S 2nd St
- 74 County St Unit 3s
- 74 County St
- 76 County St
- 76 County St Unit 1A
- 587 S 2nd St
- 575 S 2nd St
- 577 S 2nd St
- 80 County St
- 7 Nelson St
- 7 Nelson St Unit 1
- 68-70 Division St
- 567 S 2nd St
- 591 S 2nd St
- 76 Division St
- 62 County St
- 66 Division St Unit 70
- 68 Division St
- 64 Division St