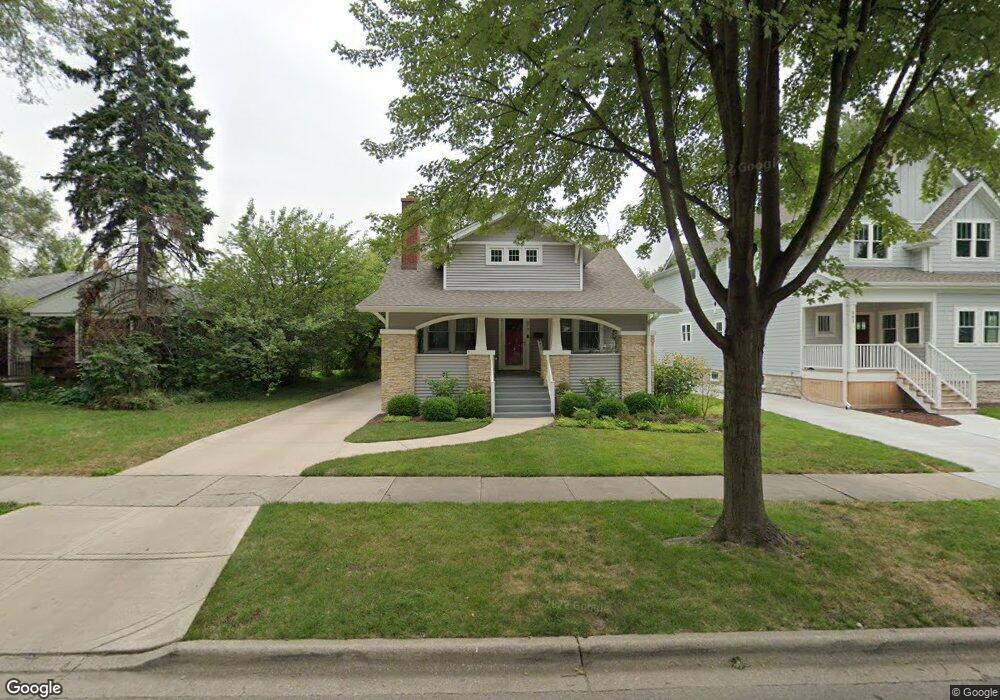
579 S Bryan St Elmhurst, IL 60126
Estimated Value: $607,088 - $1,001,000
Studio
--
Bath
1,680
Sq Ft
$447/Sq Ft
Est. Value
About This Home
This home is located at 579 S Bryan St, Elmhurst, IL 60126 and is currently estimated at $750,772, approximately $446 per square foot. 579 S Bryan St is a home located in DuPage County with nearby schools including Lincoln Elementary School, Bryan Middle School, and York Community High School.
Ownership History
Date
Name
Owned For
Owner Type
Purchase Details
Closed on
Sep 24, 2015
Sold by
Thompson Douglas M and Thompson Anne D
Bought by
Douglas & Anne Thompson Family Trust
Current Estimated Value
Purchase Details
Closed on
Apr 29, 2002
Sold by
Thompson Douglas M and Thompson Anne D
Bought by
Thompson Douglas M and Thompson Anne D
Home Financials for this Owner
Home Financials are based on the most recent Mortgage that was taken out on this home.
Original Mortgage
$287,000
Outstanding Balance
$123,828
Interest Rate
7.24%
Estimated Equity
$626,944
Purchase Details
Closed on
Jan 22, 2001
Sold by
Thompson Doug and Thompson Anne
Bought by
Thompson Douglas M and Thompson Anne D
Purchase Details
Closed on
Aug 21, 1996
Sold by
Leader Margaret J and Stevens Nancy C
Bought by
Thompson Doug and Thompson Anne
Home Financials for this Owner
Home Financials are based on the most recent Mortgage that was taken out on this home.
Original Mortgage
$167,100
Interest Rate
8.29%
Create a Home Valuation Report for This Property
The Home Valuation Report is an in-depth analysis detailing your home's value as well as a comparison with similar homes in the area
Home Values in the Area
Average Home Value in this Area
Purchase History
| Date | Buyer | Sale Price | Title Company |
|---|---|---|---|
| Douglas & Anne Thompson Family Trust | -- | Attorney | |
| Thompson Douglas M | -- | Integrity Title | |
| Thompson Douglas M | -- | -- | |
| Thompson Doug | $176,000 | Intercounty Title |
Source: Public Records
Mortgage History
| Date | Status | Borrower | Loan Amount |
|---|---|---|---|
| Open | Thompson Douglas M | $287,000 | |
| Closed | Thompson Doug | $167,100 |
Source: Public Records
Tax History
| Year | Tax Paid | Tax Assessment Tax Assessment Total Assessment is a certain percentage of the fair market value that is determined by local assessors to be the total taxable value of land and additions on the property. | Land | Improvement |
|---|---|---|---|---|
| 2024 | $10,104 | $175,663 | $84,847 | $90,816 |
| 2023 | $9,376 | $162,440 | $78,460 | $83,980 |
| 2022 | $9,105 | $156,150 | $75,420 | $80,730 |
| 2021 | $8,878 | $152,260 | $73,540 | $78,720 |
| 2020 | $8,534 | $148,920 | $71,930 | $76,990 |
| 2019 | $8,352 | $141,590 | $68,390 | $73,200 |
| 2018 | $7,932 | $134,030 | $64,730 | $69,300 |
| 2017 | $7,755 | $127,720 | $61,680 | $66,040 |
| 2016 | $7,589 | $120,320 | $58,110 | $62,210 |
| 2015 | $7,509 | $112,100 | $54,140 | $57,960 |
| 2014 | $7,952 | $109,190 | $42,970 | $66,220 |
| 2013 | $7,867 | $110,730 | $43,580 | $67,150 |
Source: Public Records
Map
Nearby Homes
- 570 S Parkside Ave
- 15 Manchester Ln
- 611 S Prospect Ave
- 606 S York St
- 500 S Kenilworth Ave
- 680 S Bryan St
- 474 S York St
- 696 S Prospect Ave
- 580 S Kearsage Ave
- 171 E Cayuga Ave
- 160 E Cayuga Ave
- 769 S Prospect Ave
- 742 S Saylor Ave
- 224 E May St
- 594 S Fairfield Ave
- 274 E Crescent Ave
- 251 E South St
- 663 S Hawthorne Ave
- 366 W Eggleston Ave
- 277 E Oneida Ave
- 583 S Bryan St
- 565 S Bryan St
- 140 W Meister Ave
- 587 S Bryan St
- 576 S Bryan St
- 566 S Bryan St
- 582 S Bryan St
- 562 S Bryan St
- 591 S Bryan St
- 584 S Bryan St
- 576 S Washington St
- 578 S Washington St
- 593 S Bryan St
- 582 S Washington St
- 590 S Bryan St
- 567 S Parkside Ave
- 571 S Parkside Ave
- 595 S Bryan St
- 592 S Bryan St
- 592 S Washington St
Your Personal Tour Guide
Ask me questions while you tour the home.