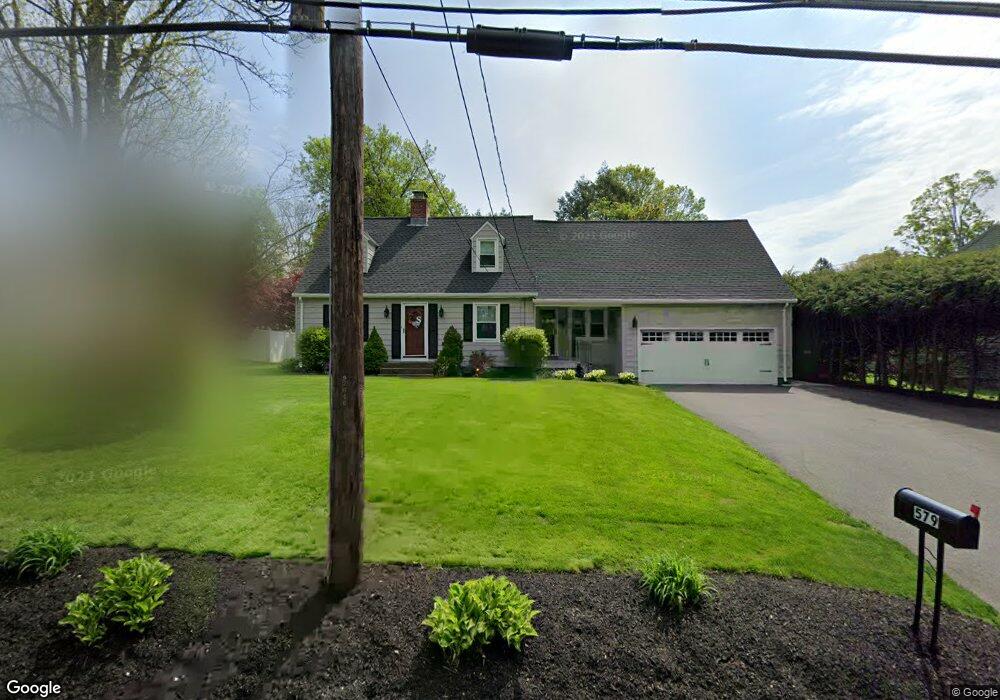
579 West St Southington, CT 06489
West Southington NeighborhoodEstimated Value: $391,000 - $438,000
3
Beds
3
Baths
1,764
Sq Ft
$238/Sq Ft
Est. Value
About This Home
This home is located at 579 West St, Southington, CT 06489 and is currently estimated at $420,659, approximately $238 per square foot. 579 West St is a home located in Hartford County with nearby schools including Urbin T. Kelley Elementary School, Joseph A. Depaolo Middle School, and Southington High School.
Ownership History
Date
Name
Owned For
Owner Type
Purchase Details
Closed on
Jun 30, 2008
Sold by
Callahan Edward J
Bought by
Shaniey James J and Shaniey Kristen L
Current Estimated Value
Home Financials for this Owner
Home Financials are based on the most recent Mortgage that was taken out on this home.
Original Mortgage
$278,600
Interest Rate
6.07%
Purchase Details
Closed on
Jul 10, 2006
Sold by
Pulaski Charles A and Pulaski Susan C
Bought by
Callahan Edward J
Create a Home Valuation Report for This Property
The Home Valuation Report is an in-depth analysis detailing your home's value as well as a comparison with similar homes in the area
Home Values in the Area
Average Home Value in this Area
Purchase History
| Date | Buyer | Sale Price | Title Company |
|---|---|---|---|
| Shaniey James J | $310,000 | -- | |
| Callahan Edward J | $296,000 | -- |
Source: Public Records
Mortgage History
| Date | Status | Borrower | Loan Amount |
|---|---|---|---|
| Open | Callahan Edward J | $279,000 | |
| Closed | Callahan Edward J | $278,600 | |
| Previous Owner | Callahan Edward J | $234,000 |
Source: Public Records
Tax History Compared to Growth
Tax History
| Year | Tax Paid | Tax Assessment Tax Assessment Total Assessment is a certain percentage of the fair market value that is determined by local assessors to be the total taxable value of land and additions on the property. | Land | Improvement |
|---|---|---|---|---|
| 2025 | $5,194 | $156,400 | $50,750 | $105,650 |
| 2024 | $4,917 | $156,400 | $50,750 | $105,650 |
| 2023 | $4,748 | $156,400 | $50,750 | $105,650 |
| 2022 | $4,556 | $156,400 | $50,750 | $105,650 |
| 2021 | $4,540 | $156,400 | $50,750 | $105,650 |
| 2020 | $4,306 | $140,570 | $45,320 | $95,250 |
| 2019 | $4,281 | $139,720 | $45,320 | $94,400 |
| 2018 | $4,259 | $139,720 | $45,320 | $94,400 |
| 2017 | $4,259 | $139,720 | $45,320 | $94,400 |
| 2016 | $4,141 | $139,720 | $45,320 | $94,400 |
| 2015 | $3,990 | $136,910 | $43,160 | $93,750 |
| 2014 | $3,883 | $136,910 | $43,160 | $93,750 |
Source: Public Records
Map
Nearby Homes