Estimated Value: $300,000 - $332,000
4
Beds
2
Baths
1,852
Sq Ft
$168/Sq Ft
Est. Value
About This Home
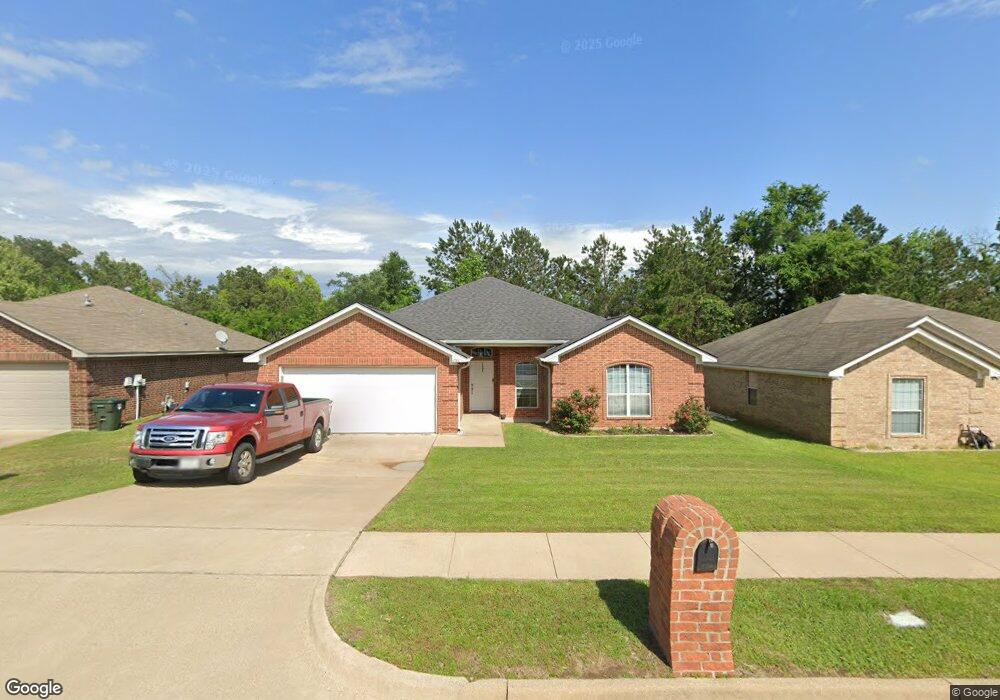
This home is located at 5794 Palo Pinto Dr, Tyler, TX 75707 and is currently estimated at $310,796, approximately $167 per square foot. 5794 Palo Pinto Dr is a home located in Smith County with nearby schools including H.L. Higgins Elementary School, J.W. Holloway Sixth Grade School, and Whitehouse High School.
Ownership History
Date
Name
Owned For
Owner Type
Purchase Details
Closed on
May 9, 2016
Sold by
Park Young
Bought by
Sorrell Ty D and Sorrell Kylie D
Current Estimated Value
Home Financials for this Owner
Home Financials are based on the most recent Mortgage that was taken out on this home.
Original Mortgage
$148,809
Outstanding Balance
$117,191
Interest Rate
3.5%
Mortgage Type
FHA
Estimated Equity
$193,605
Purchase Details
Closed on
Jun 21, 2007
Sold by
Lindale Tyler Lp
Bought by
Park Young
Home Financials for this Owner
Home Financials are based on the most recent Mortgage that was taken out on this home.
Original Mortgage
$131,850
Interest Rate
6.19%
Mortgage Type
Purchase Money Mortgage
Purchase Details
Closed on
Jul 12, 2006
Sold by
Hfg Rl Inv 05 Ltd
Bought by
Lindale Tyler Lp
Home Financials for this Owner
Home Financials are based on the most recent Mortgage that was taken out on this home.
Original Mortgage
$114,152
Interest Rate
6.67%
Mortgage Type
Construction
Create a Home Valuation Report for This Property
The Home Valuation Report is an in-depth analysis detailing your home's value as well as a comparison with similar homes in the area
Home Values in the Area
Average Home Value in this Area
Purchase History
| Date | Buyer | Sale Price | Title Company |
|---|---|---|---|
| Sorrell Ty D | -- | None Available | |
| Park Young | -- | None Available | |
| Lindale Tyler Lp | -- | None Available |
Source: Public Records
Mortgage History
| Date | Status | Borrower | Loan Amount |
|---|---|---|---|
| Open | Sorrell Ty D | $148,809 | |
| Previous Owner | Park Young | $131,850 | |
| Previous Owner | Lindale Tyler Lp | $114,152 |
Source: Public Records
Tax History Compared to Growth
Tax History
| Year | Tax Paid | Tax Assessment Tax Assessment Total Assessment is a certain percentage of the fair market value that is determined by local assessors to be the total taxable value of land and additions on the property. | Land | Improvement |
|---|---|---|---|---|
| 2025 | $3,280 | $312,281 | $44,199 | $268,082 |
| 2024 | $3,280 | $318,065 | $37,500 | $280,565 |
| 2023 | $4,525 | $297,257 | $37,500 | $259,757 |
| 2022 | $4,036 | $231,349 | $32,500 | $198,849 |
| 2021 | $3,780 | $202,294 | $32,500 | $169,794 |
| 2020 | $3,759 | $194,774 | $32,500 | $162,274 |
| 2019 | $3,691 | $185,048 | $25,000 | $160,048 |
| 2018 | $3,348 | $168,845 | $25,000 | $143,845 |
| 2017 | $2,960 | $168,845 | $25,000 | $143,845 |
| 2016 | $2,967 | $169,236 | $25,000 | $144,236 |
| 2015 | $2,743 | $161,900 | $25,000 | $136,900 |
| 2014 | $2,743 | $157,393 | $25,000 | $132,393 |
Source: Public Records
Map
Nearby Homes
- 5793 Palo Pinto Dr
- 5832 Mustang Trail
- 3123 Oak Bend
- 3114 Arbor Oak Dr
- 5803 Persimmon Dr
- 3110 Tallow Oak Cir
- 5718 Gloucester Dr
- 5401 Andover Dr
- 5841 Havens Trail
- 3217 Libbie St
- 5905 Havens Trail
- 5415 Andover Dr
- 3139 Granbury Ct
- 5906 Mesquite Dr
- 5623 Berkeley Dr
- 5527 Andover Dr
- 6015 Pine Cone Ln
- 6223 Mesquite Dr
- 6039 Pine Cone Ln
- 6136 Graemont Blvd
- 5794 5794 Palo Pinto Dr
- 5816 5816 Palo Pinto Dr
- 5816 Palo Pinto Dr
- 5782 Palo Pinto Dr
- 5828 5828 Palo Pinto Dr
- 5770 Palo Pinto Dr
- 5828 Palo Pinto Dr
- 5770 5770 Palo Pinto Dr
- 5758 5758 Palo Pinto
- 5832 Palo Pinto Dr
- 5758 Palo Pinto Dr
- 5815 5815 Palo Pinto
- 5815 Palo Pinto Dr
- 5781 Palo Pinto Dr
- 5827 Palo Pinto Dr
- 5769 Palo Pinto Dr
- 5769 5769 Palo Pinto Dr
- 5844 5844 Palo Pinto
- 5844 Palo Pinto Dr
- 5757 5757 Palo Pinto