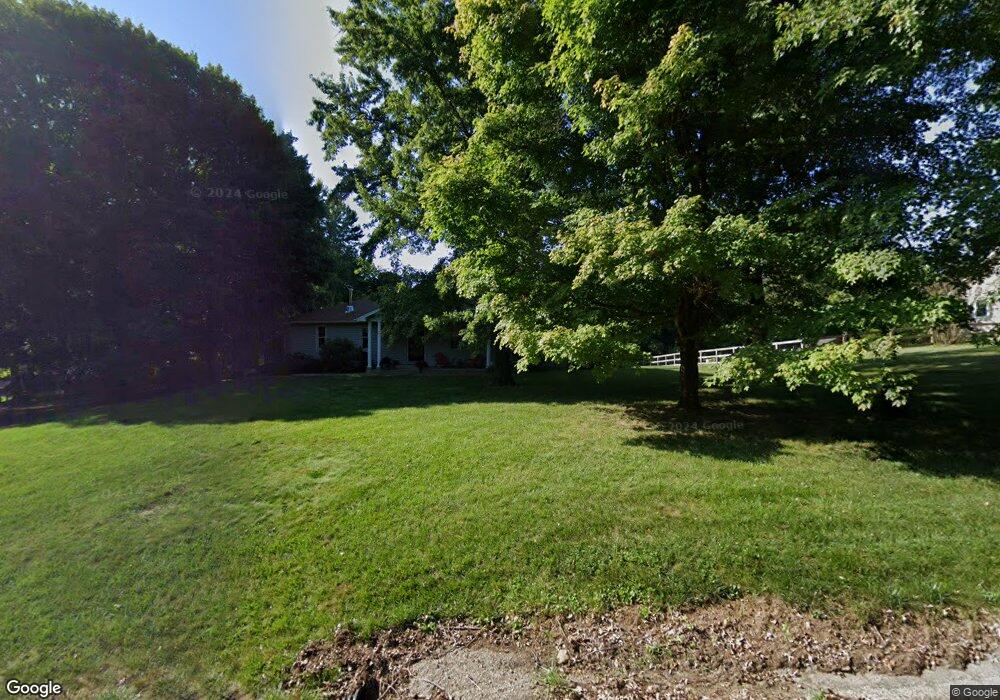
5795 Coonpath Rd Carroll, OH 43112
Bloom NeighborhoodEstimated Value: $356,395 - $414,000
2
Beds
2
Baths
2,182
Sq Ft
$176/Sq Ft
Est. Value
About This Home
This home is located at 5795 Coonpath Rd, Carroll, OH 43112 and is currently estimated at $384,849, approximately $176 per square foot. 5795 Coonpath Rd is a home located in Fairfield County with nearby schools including Bloom Carroll Primary School, Bloom Carroll Intermediate School, and Bloom-Carroll Middle School.
Ownership History
Date
Name
Owned For
Owner Type
Purchase Details
Closed on
Oct 9, 2017
Sold by
Haffey Edward O and Haffey David T
Bought by
Galilei Joseph A
Current Estimated Value
Home Financials for this Owner
Home Financials are based on the most recent Mortgage that was taken out on this home.
Original Mortgage
$153,850
Interest Rate
3.86%
Mortgage Type
New Conventional
Purchase Details
Closed on
Apr 25, 2017
Sold by
Haffey Helen S
Bought by
Edward O Haffey and David T Haffey
Purchase Details
Closed on
May 28, 1993
Sold by
Haffey Eugene E
Bought by
Haffey Eugene E
Create a Home Valuation Report for This Property
The Home Valuation Report is an in-depth analysis detailing your home's value as well as a comparison with similar homes in the area
Home Values in the Area
Average Home Value in this Area
Purchase History
| Date | Buyer | Sale Price | Title Company |
|---|---|---|---|
| Galilei Joseph A | $181,000 | Northwest Title Family Of Co | |
| Edward O Haffey | -- | -- | |
| Haffey Eugene E | -- | -- |
Source: Public Records
Mortgage History
| Date | Status | Borrower | Loan Amount |
|---|---|---|---|
| Previous Owner | Galilei Joseph A | $153,850 |
Source: Public Records
Tax History
| Year | Tax Paid | Tax Assessment Tax Assessment Total Assessment is a certain percentage of the fair market value that is determined by local assessors to be the total taxable value of land and additions on the property. | Land | Improvement |
|---|---|---|---|---|
| 2025 | $7,345 | $124,340 | $32,450 | $91,890 |
| 2024 | $7,345 | $91,020 | $21,420 | $69,600 |
| 2023 | $3,972 | $91,020 | $21,420 | $69,600 |
| 2022 | $4,000 | $91,020 | $21,420 | $69,600 |
| 2021 | $3,225 | $72,000 | $16,870 | $55,130 |
| 2020 | $3,264 | $72,000 | $16,870 | $55,130 |
| 2019 | $3,278 | $72,000 | $16,870 | $55,130 |
| 2018 | $2,256 | $46,570 | $11,030 | $35,540 |
| 2017 | $1,924 | $55,010 | $19,470 | $35,540 |
| 2016 | $1,866 | $55,010 | $19,470 | $35,540 |
| 2015 | $1,850 | $53,420 | $19,470 | $33,950 |
| 2014 | $1,768 | $53,420 | $19,470 | $33,950 |
| 2013 | $1,768 | $53,420 | $19,470 | $33,950 |
Source: Public Records
Map
Nearby Homes
- 3540 Carroll-Southern Rd NW
- 3510 Kauffman Rd NW
- 2115 Lamb Rd NW
- 2291 Carroll-Southern Rd NW
- 2155 Carroll-Southern Rd NW
- 52 W Canal St
- 50 Market St
- 7195 Alspach Rd NW
- 5341 Carnes Rd NW
- 5699 Feldon Ct NW
- 3355 Old Columbus Rd NW
- 8322 Benson Rd
- 10 Mount Zion Rd NW
- 3076 Lithopolis Rd NW
- 6985 Royalton Rd SW
- 5840 High St NW
- 2270 Ginder Rd NW
- 55 Betz Rd SW
- 7835 E Ohio State Ln NW
- 681 Mount Zion Rd SW
- 5795 Coonpath Rd NW
- 5835 Coonpath Rd NW
- 5835 Coonpath Rd
- 5755 Coonpath Rd
- 5755 Coonpath Rd
- 5775 Coonpath Rd
- 5800 Coonpath Rd
- 5875 Coonpath Rd
- 5860 Coonpath Rd
- 5715 Coonpath Rd
- 3021 Kauffman Rd
- 5915 Coonpath Rd NW
- 5900 Coonpath Rd NW
- 5915 Coonpath Rd
- 3010 Kauffman Rd NW
- 5900 Coonpath Rd
- 3004 Kauffman Rd
- 3010 Kauffman Rd
- 4695 Coonpath Rd
- 3061 Kauffman Rd
Your Personal Tour Guide
Ask me questions while you tour the home.